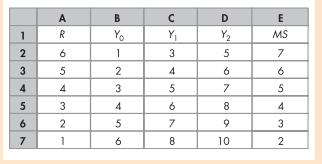
*7 The spreadsheet figure provides information about the demand for money and supply of it in Minland....
Question:
*7 The spreadsheet figure provides information about the demand for money and supply of it in Minland. Column A is the interest rate, R. Columns B, C, and D show the quantity of money demanded at three different levels of real GDP: Y0 is £10 billion, Y1 is £20 billion, and Y2 is £30 billion. Column E shows the supply of money. Initially, real GDP is £20 billion.

Draw a graph to show the demand for money, supply of money and money market equilibrium in Minland and explain what happens in Minland if the interest rate: a Exceeds 4 per cent a year? b Is less than 4 per cent a year? c Equals 4 per cent a year?
Fantastic news! We've Found the answer you've been seeking!
Step by Step Answer:
Related Book For 

Question Posted:


