

1. The following table shows the price and the quantity demanded of apples (per week). a. Plot...
Question:
1. The following table shows the price and the quantity demanded of apples (per week).
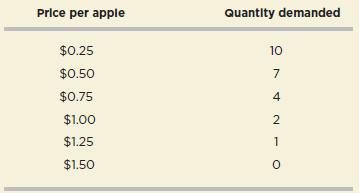
a. Plot the data provided in the table into a graph.
b. Is the relationship between the price of apples and the quantity demanded negative or positive?
Fantastic news! We've Found the answer you've been seeking!
Step by Step Answer:

Answered By
Vikash Gupta
I am graduated in Physics in 2018, from KIRORIMAL COLLEGE, University of Delhi. Now I am persuing Master's degree in physics. I like to do physics problems. I have experience of 1 year in tutoring. I think Physics is the only subject where you understand things,how they are happening . In physics you learn Maths and apply it. So I would like to join your platform to solve many Physics problems.
5+ Reviews
10+ Question Solved
Related Book For 

Question Posted:
