

Question: Explain why the transmission spectrum in Figure 19-32 is calculated from the quotient (sample transform)/(background transform) instead of the difference (sample transform) - (background transform).
Explain why the transmission spectrum in Figure 19-32 is calculated from the quotient (sample transform)/(background transform) instead of the difference (sample transform) - (background transform).
Figure 19-32
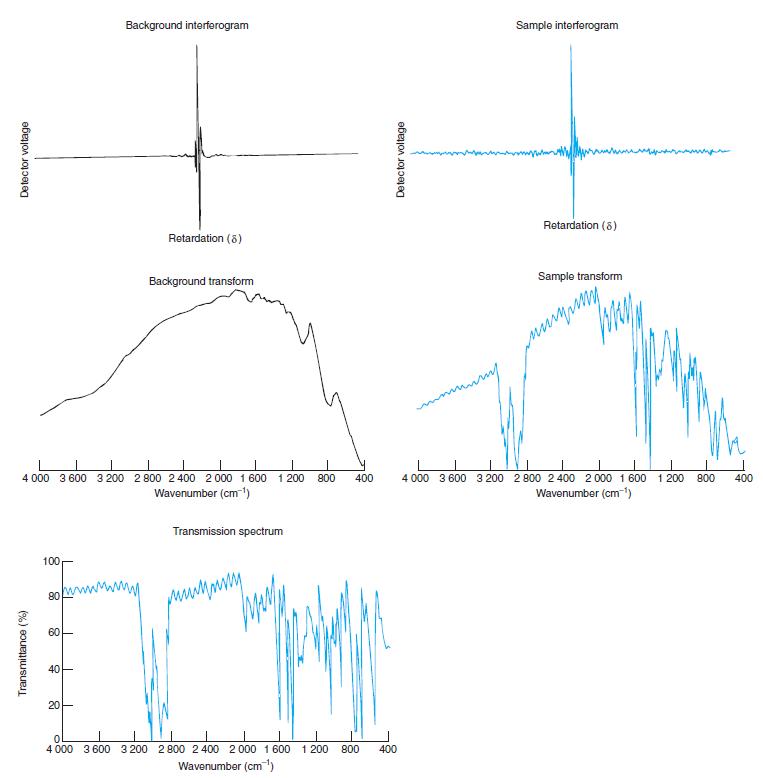
Background interferogram Sample interferogram Retardation (8) Retardation (8) Sample transform Background transform 4 000 3 600 3 200 2 800 2 400 2 000 1 600 1200 800 400 4 000 3 600 3 200 2 800 2 400 2 000 1 600 1 200 800 400 Wavenumber (cm) Wavenumber (cm) Transmission spectrum 100 80wwwwwmM 40 20- 4 000 3 600 3 200 2 800 2 400 2 000 1 600 1 200 800 400 Wavenumber (cm) Transmittance (%) Detector voltage Detector voltage
Step by Step Solution
3.46 Rating (153 Votes )
There are 3 Steps involved in it
The transmission spectrum in Figure 19 32 is calculated ... View full answer

Get step-by-step solutions from verified subject matter experts