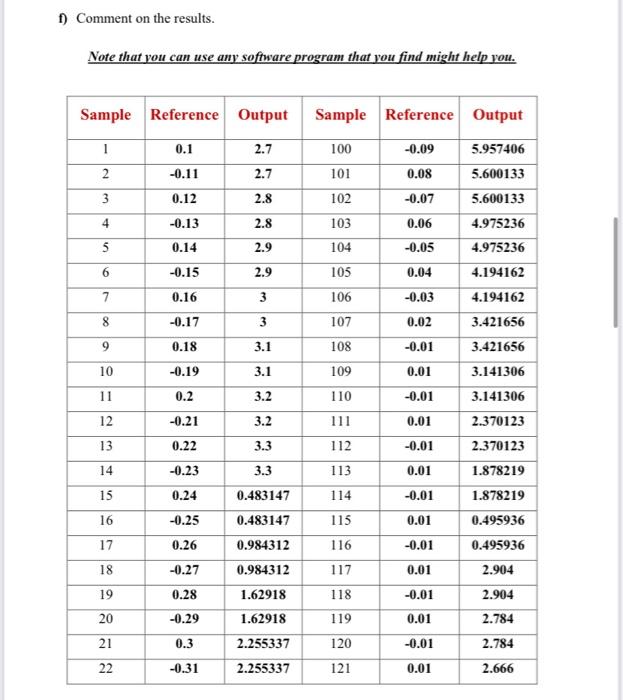
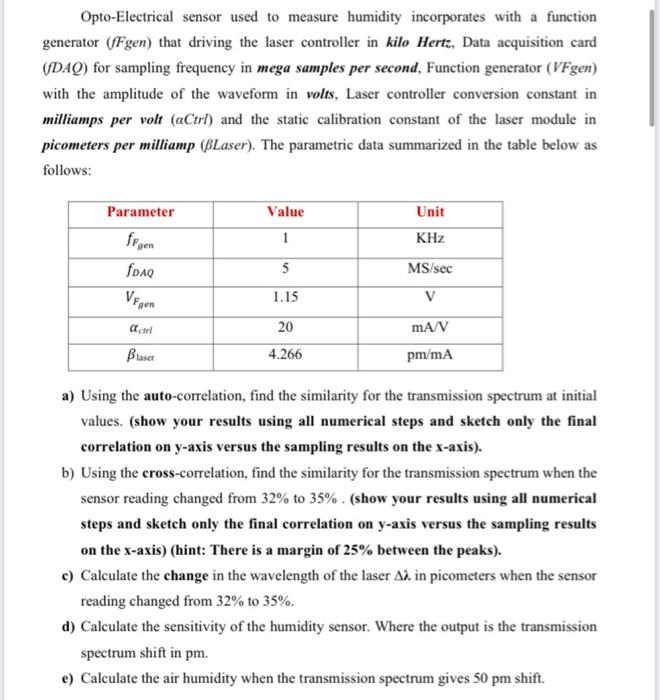
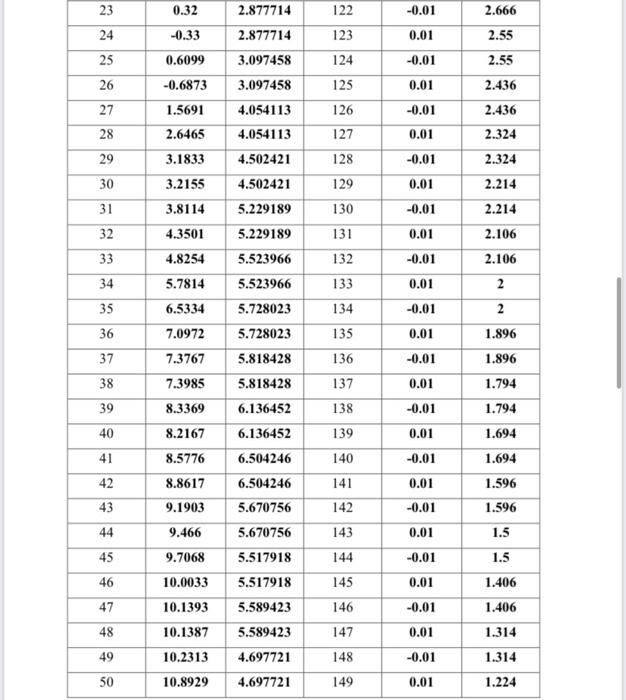
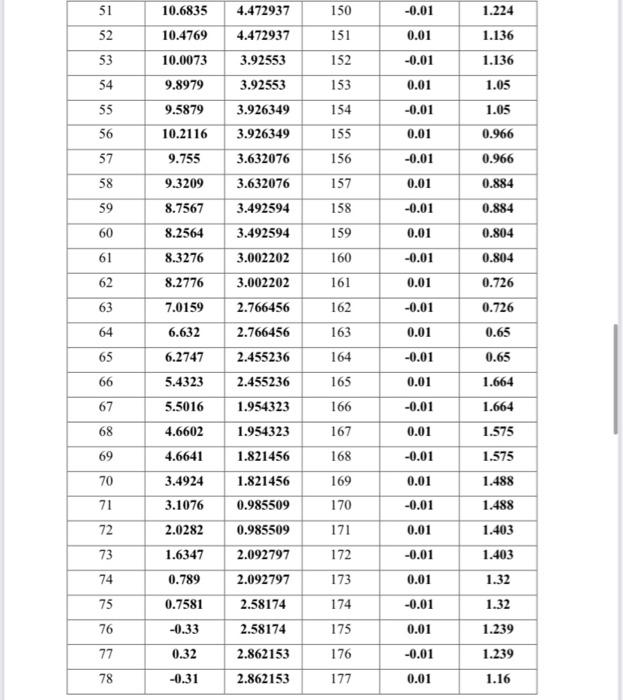
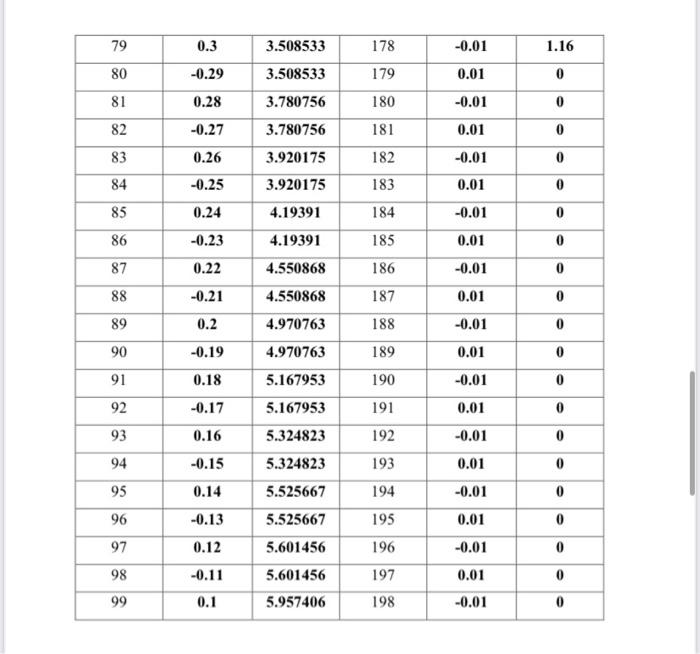
Comment on the results. Note that you can use any software program that you find might help you. Opto-Electrical sensor used to measure humidity incorporates with a function generator (fFgen) that driving the laser controller in kilo Hertz, Data acquisition card ( fDAQ ) for sampling frequency in mega samples per second, Function generator (VFgen) with the amplitude of the waveform in volts, Laser controller conversion constant in milliamps per volt (aCtrl) and the static calibration constant of the laser module in picometers per milliamp (BLaser). The parametric data summarized in the table below as follows: a) Using the auto-correlation, find the similarity for the transmission spectrum at initial values. (show your results using all numerical steps and sketch only the final correlation on y-axis versus the sampling results on the x-axis). b) Using the cross-correlation, find the similarity for the transmission spectrum when the sensor reading changed from 32% to 35%. (show your results using all numerical steps and sketch only the final correlation on y-axis versus the sampling results on the x-axis) (hint: There is a margin of 25% between the peaks). c) Calculate the change in the wavelength of the laser in picometers when the sensor reading changed from 32% to 35%. d) Calculate the sensitivity of the humidity sensor. Where the output is the transmission spectrum shift in pm. e) Calculate the air humidity when the transmission spectrum gives 50pm shift. \begin{tabular}{|c|c|c|c|c|c|} \hline 79 & 0.3 & 3.508533 & 178 & 0.01 & 1.16 \\ \hline 80 & 0.29 & 3.508533 & 179 & 0.01 & 0 \\ \hline 81 & 0.28 & 3.780756 & 180 & 0.01 & 0 \\ \hline 82 & 0.27 & 3.780756 & 181 & 0.01 & 0 \\ \hline 83 & 0.26 & 3.920175 & 182 & 0.01 & 0 \\ \hline 84 & 0.25 & 3.920175 & 183 & 0.01 & 0 \\ \hline 85 & 0.24 & 4.19391 & 184 & 0.01 & 0 \\ \hline 86 & 0.23 & 4.19391 & 185 & 0.01 & 0 \\ \hline 87 & 0.22 & 4.550868 & 186 & 0.01 & 0 \\ \hline 88 & 0.21 & 4.550868 & 187 & 0.01 & 0 \\ \hline 89 & 0.2 & 4.970763 & 188 & 0.01 & 0 \\ \hline 90 & 0.19 & 4.970763 & 189 & 0.01 & 0 \\ \hline 91 & 0.18 & 5.167953 & 190 & 0.01 & 0 \\ \hline 92 & 0.17 & 5.167953 & 191 & 0.01 & 0 \\ \hline 93 & 0.16 & 5.324823 & 192 & 0.01 & 0 \\ \hline 94 & 0.15 & 5.324823 & 193 & 0.01 & 0 \\ \hline 95 & 0.14 & 5.525667 & 194 & 0.01 & 0 \\ \hline 96 & 0.13 & 5.525667 & 195 & 0.01 & 0 \\ \hline 97 & 0.12 & 5.601456 & 196 & 0.01 & 0 \\ \hline 98 & 0.11 & 5.601456 & 197 & 0.01 & 0 \\ \hline 99 & 0.1 & 5.957406 & 198 & 0.01 & 0 \\ \hline \end{tabular} Comment on the results. Note that you can use any software program that you find might help you. Opto-Electrical sensor used to measure humidity incorporates with a function generator (fFgen) that driving the laser controller in kilo Hertz, Data acquisition card ( fDAQ ) for sampling frequency in mega samples per second, Function generator (VFgen) with the amplitude of the waveform in volts, Laser controller conversion constant in milliamps per volt (aCtrl) and the static calibration constant of the laser module in picometers per milliamp (BLaser). The parametric data summarized in the table below as follows: a) Using the auto-correlation, find the similarity for the transmission spectrum at initial values. (show your results using all numerical steps and sketch only the final correlation on y-axis versus the sampling results on the x-axis). b) Using the cross-correlation, find the similarity for the transmission spectrum when the sensor reading changed from 32% to 35%. (show your results using all numerical steps and sketch only the final correlation on y-axis versus the sampling results on the x-axis) (hint: There is a margin of 25% between the peaks). c) Calculate the change in the wavelength of the laser in picometers when the sensor reading changed from 32% to 35%. d) Calculate the sensitivity of the humidity sensor. Where the output is the transmission spectrum shift in pm. e) Calculate the air humidity when the transmission spectrum gives 50pm shift. \begin{tabular}{|c|c|c|c|c|c|} \hline 79 & 0.3 & 3.508533 & 178 & 0.01 & 1.16 \\ \hline 80 & 0.29 & 3.508533 & 179 & 0.01 & 0 \\ \hline 81 & 0.28 & 3.780756 & 180 & 0.01 & 0 \\ \hline 82 & 0.27 & 3.780756 & 181 & 0.01 & 0 \\ \hline 83 & 0.26 & 3.920175 & 182 & 0.01 & 0 \\ \hline 84 & 0.25 & 3.920175 & 183 & 0.01 & 0 \\ \hline 85 & 0.24 & 4.19391 & 184 & 0.01 & 0 \\ \hline 86 & 0.23 & 4.19391 & 185 & 0.01 & 0 \\ \hline 87 & 0.22 & 4.550868 & 186 & 0.01 & 0 \\ \hline 88 & 0.21 & 4.550868 & 187 & 0.01 & 0 \\ \hline 89 & 0.2 & 4.970763 & 188 & 0.01 & 0 \\ \hline 90 & 0.19 & 4.970763 & 189 & 0.01 & 0 \\ \hline 91 & 0.18 & 5.167953 & 190 & 0.01 & 0 \\ \hline 92 & 0.17 & 5.167953 & 191 & 0.01 & 0 \\ \hline 93 & 0.16 & 5.324823 & 192 & 0.01 & 0 \\ \hline 94 & 0.15 & 5.324823 & 193 & 0.01 & 0 \\ \hline 95 & 0.14 & 5.525667 & 194 & 0.01 & 0 \\ \hline 96 & 0.13 & 5.525667 & 195 & 0.01 & 0 \\ \hline 97 & 0.12 & 5.601456 & 196 & 0.01 & 0 \\ \hline 98 & 0.11 & 5.601456 & 197 & 0.01 & 0 \\ \hline 99 & 0.1 & 5.957406 & 198 & 0.01 & 0 \\ \hline \end{tabular}