Question
In order to sell a product at a profit the product must be priced higher than the total of what it costs you to build
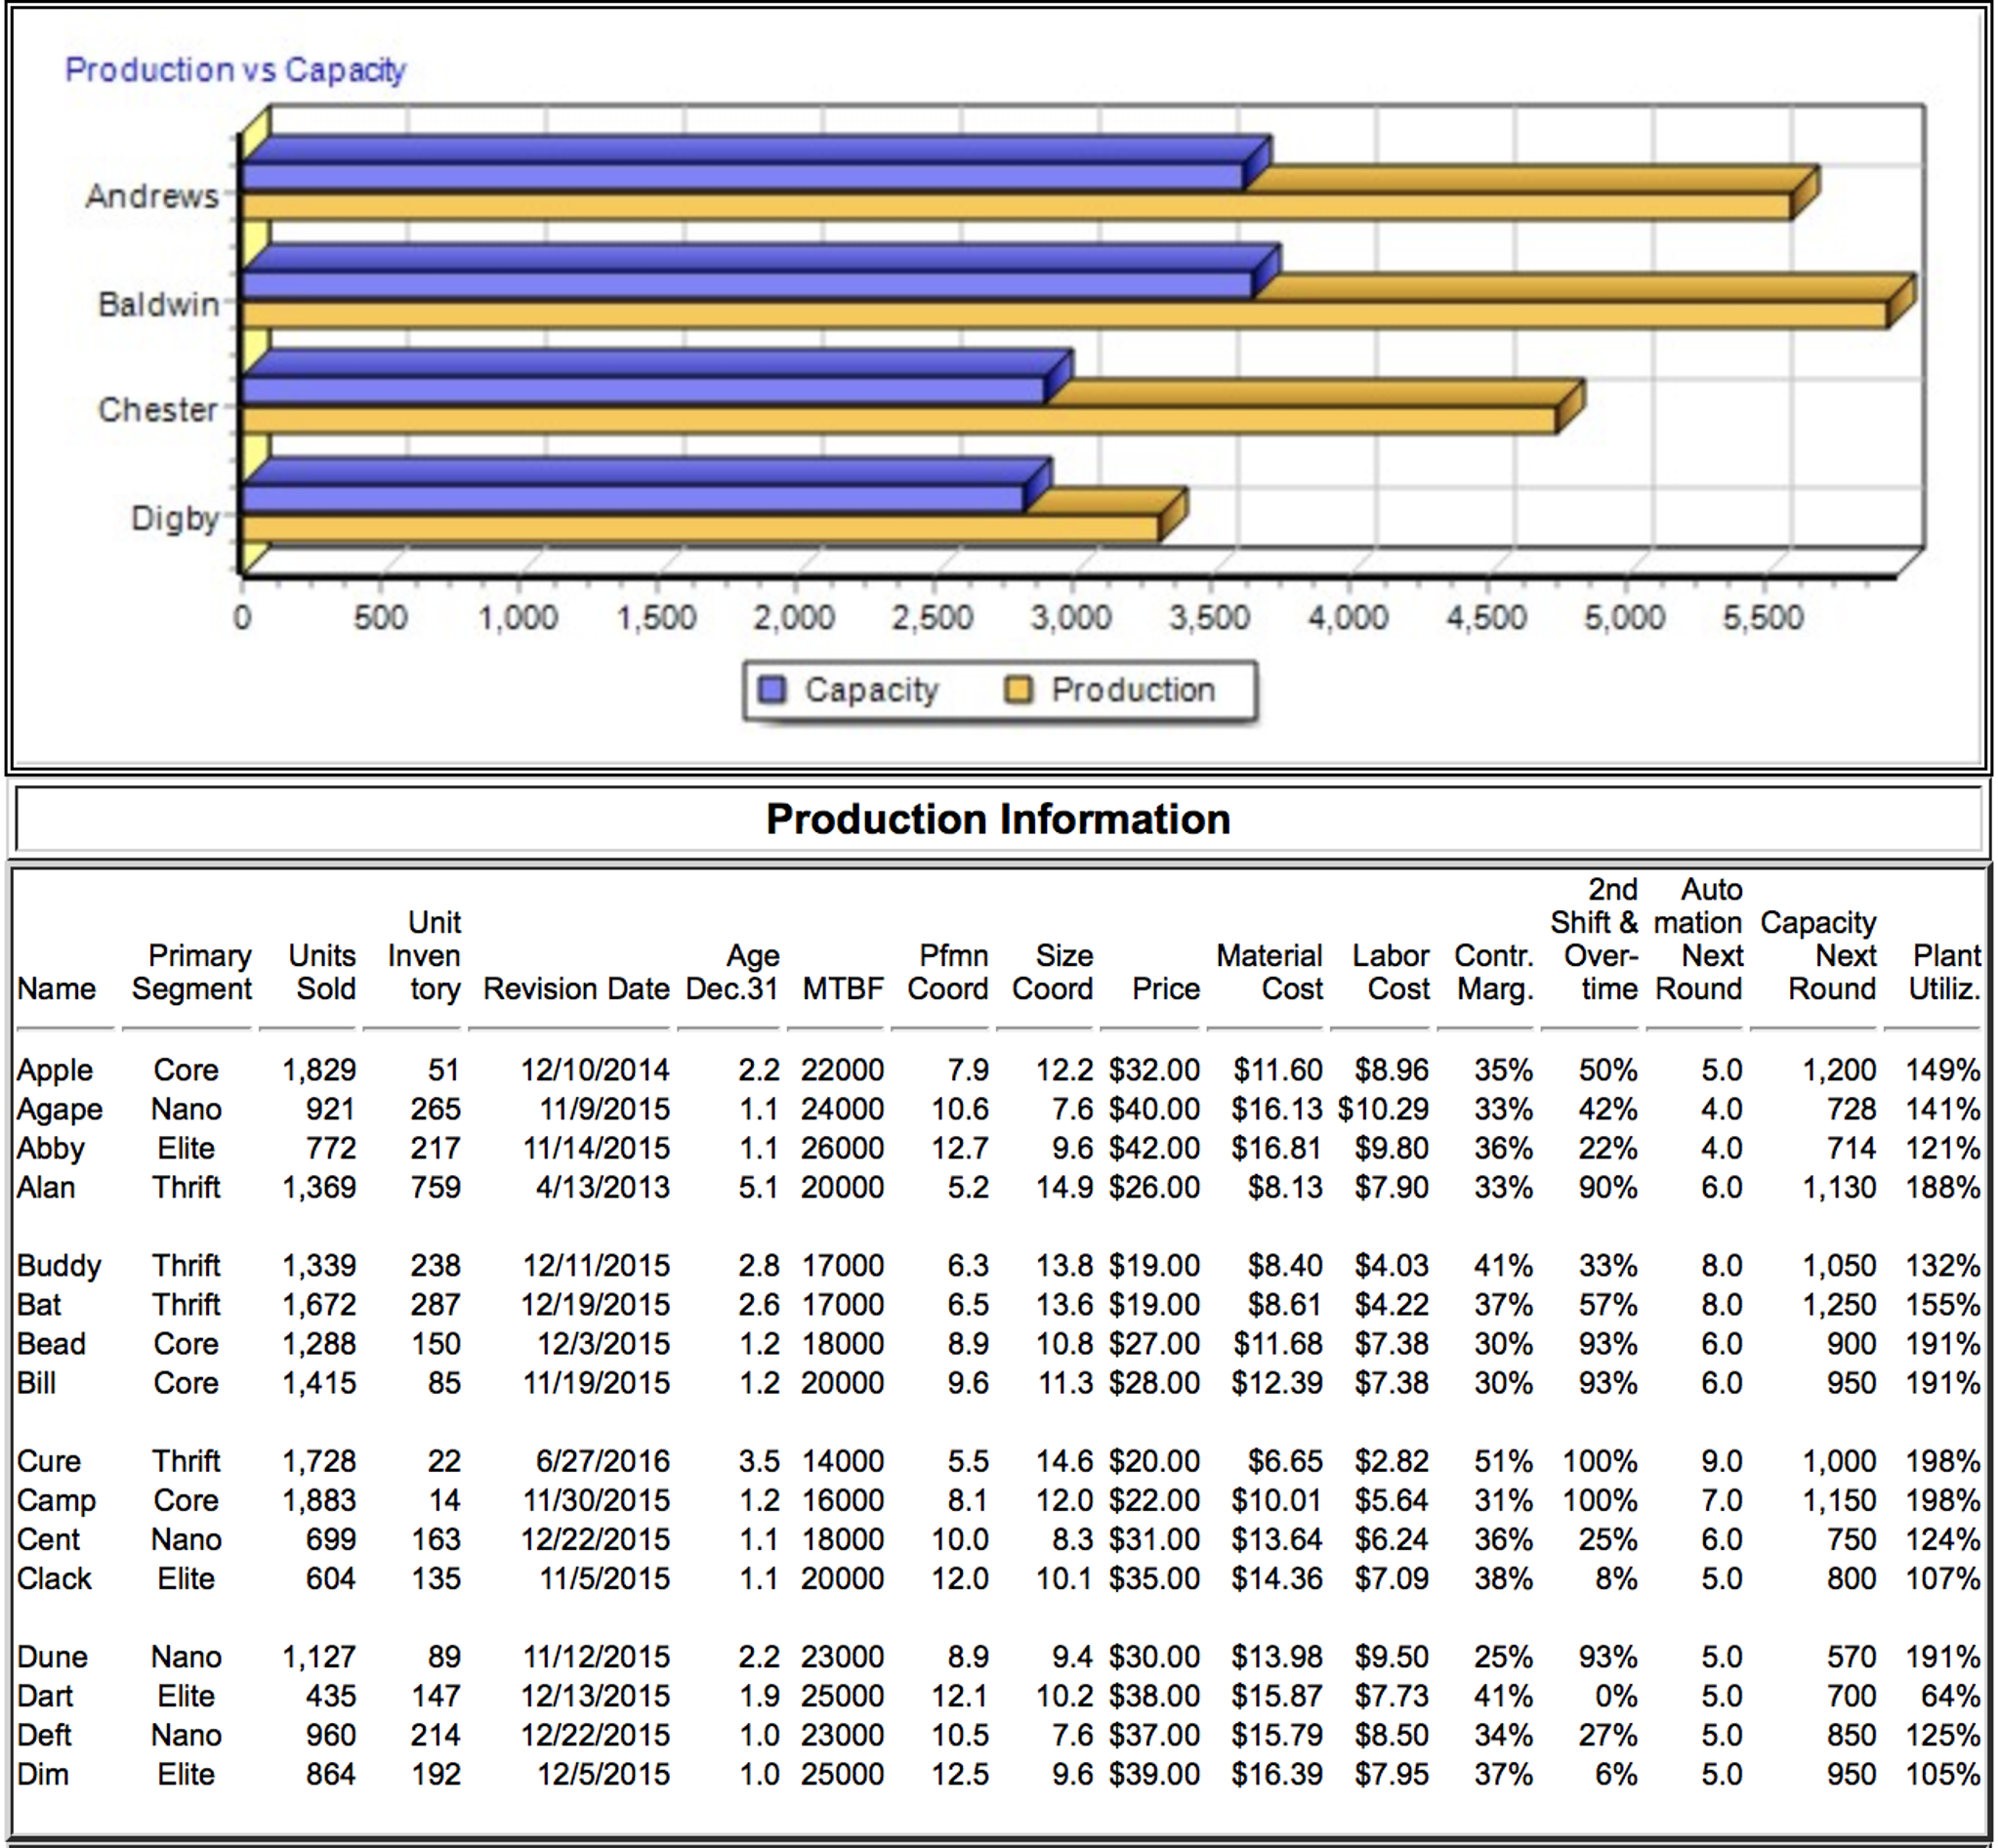
In order to sell a product at a profit the product must be priced higher than the total of what it costs you to build the unit, plus period expenses, and plus overhead. At the end of last year the broad cost leader Chester had an Elite product Clack. Use the Inquirer's Production Analysis to find Clack's production cost, (labor+materials). Exclude possible inventory carrying costs. Assume period expenses and overhead total 1/2 of their production cost. What is the minimum price the product could have been sold for to cover the unit cost, period expenses, and overhead? 

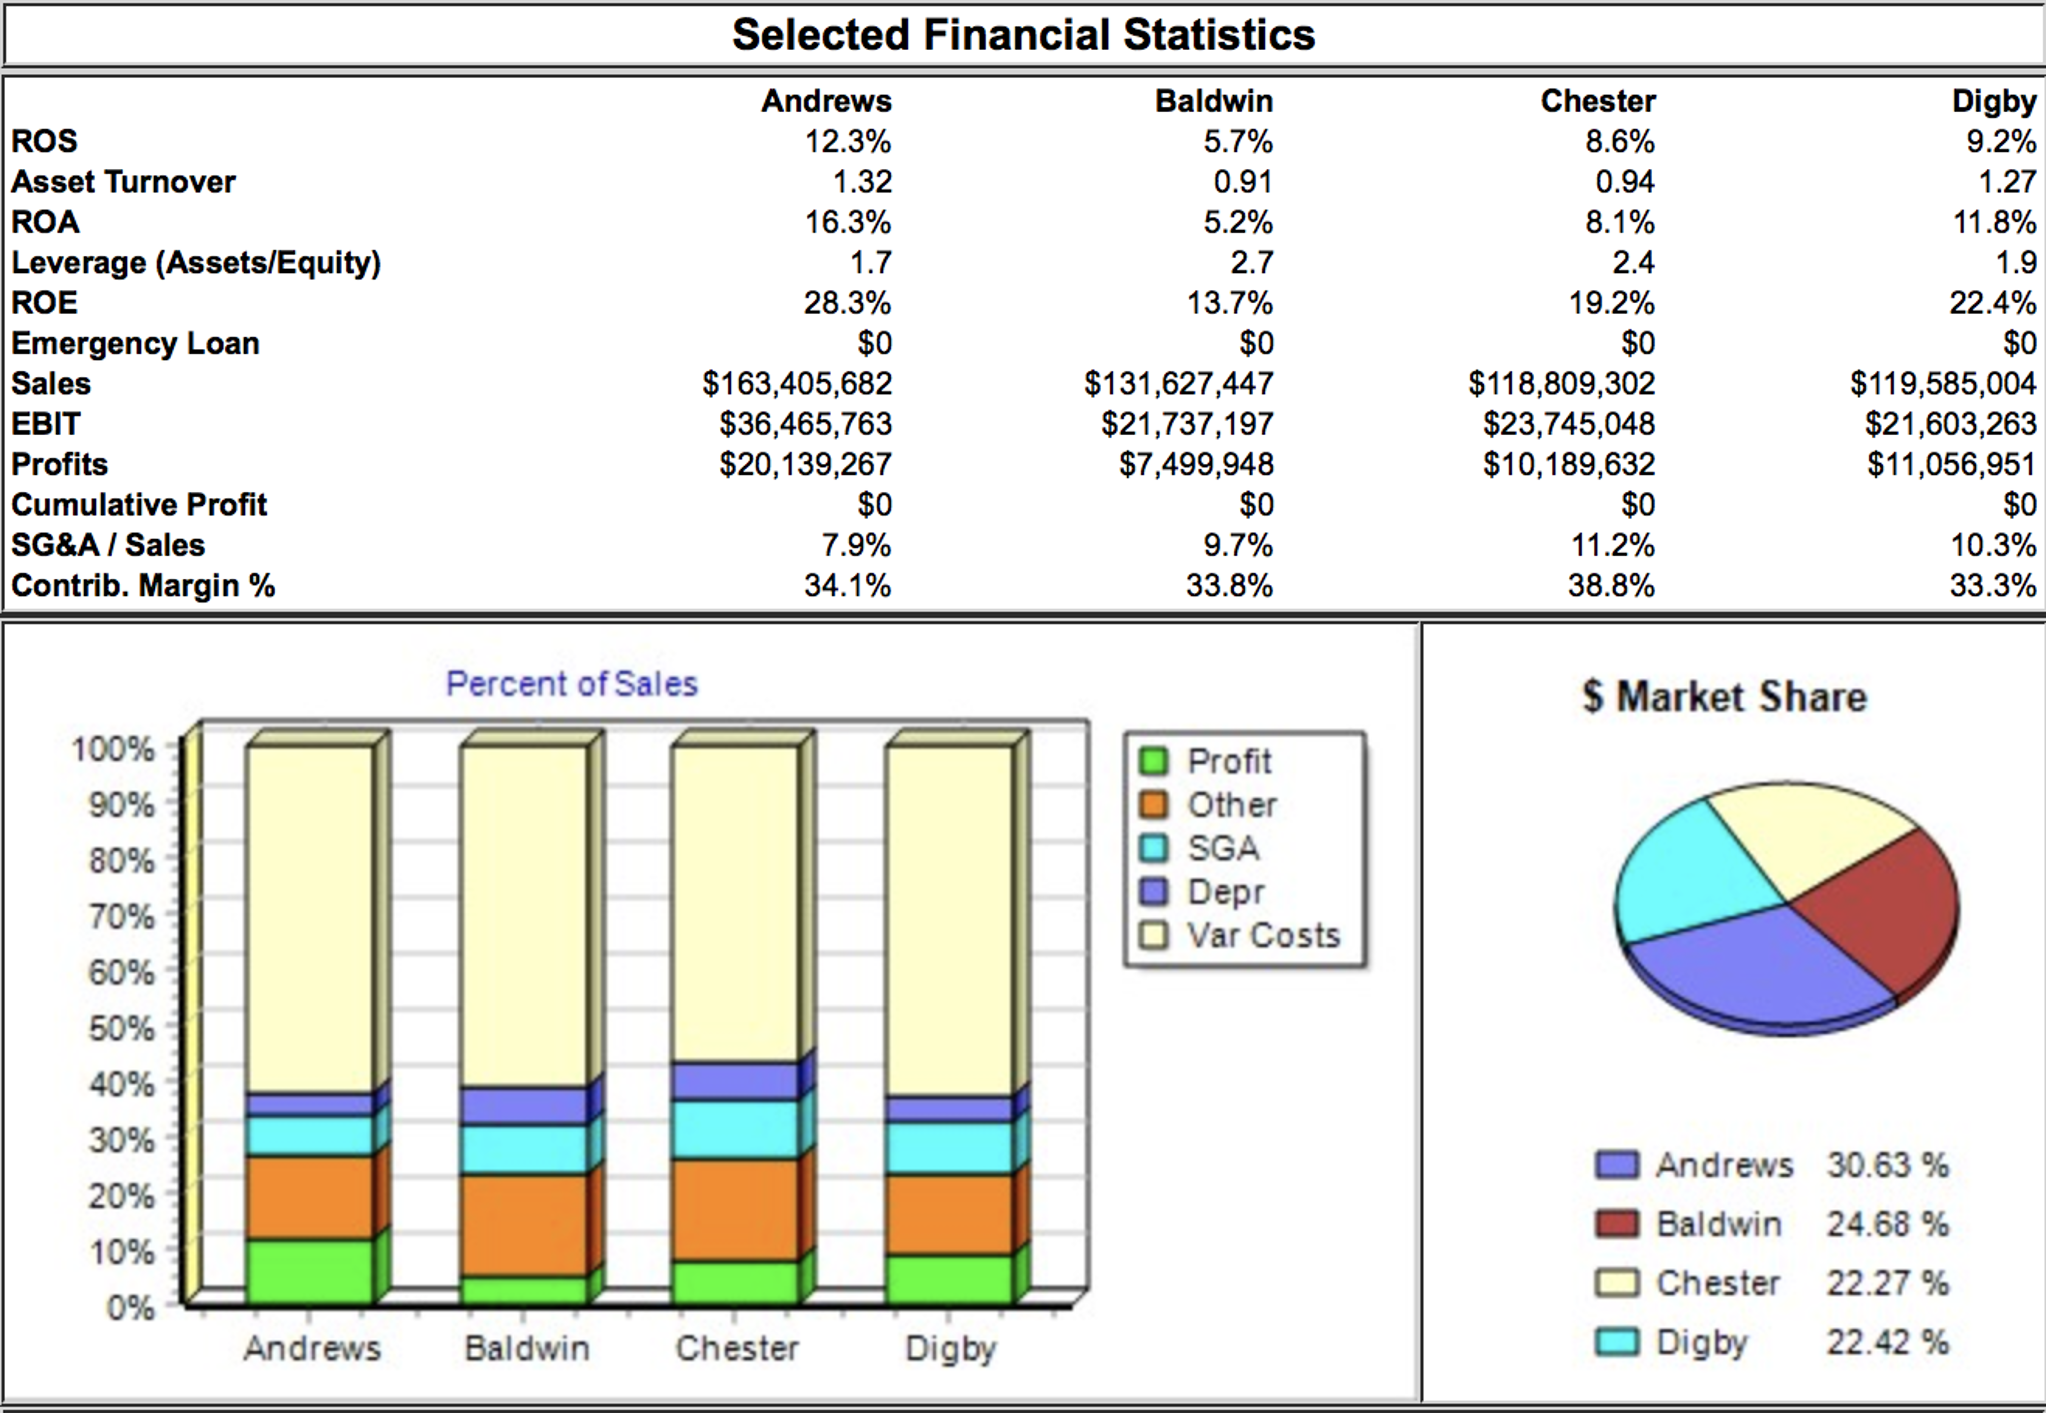
Production vs Capacity Andrews Baldwin Chester Digby Cure Camp Cent Clack 0 Buddy Thrift Bat Thrift Bead Core Bill Core 500 1,000 1,500 2,000 2,500 3,000 3,500 4,000 4,500 5,000 5,500 Apple Core 1,829 51 12/10/2014 921 265 11/9/2015 11/14/2015 4/13/2013 Agape Nano Elite 772 217 Thrift 1,369 759 Abby Alan Unit Primary Units Inven Age Pfmn Size Name Segment Sold tory Revision Date Dec.31 MTBF Coord Coord Price 1,339 238 1,672 287 1,288 150 85 1,415 Thrift 1,728 22 Nano Core 1,883 14 699 163 604 135 Elite Dune Nano 1,127 89 Dart Elite 435 147 Deft Nano 960 214 Dim Elite 864 192 12/11/2015 12/19/2015 12/3/2015 11/19/2015 6/27/2016 11/30/2015 12/22/2015 11/5/2015 Capacity 11/12/2015 12/13/2015 12/22/2015 12/5/2015 Production Information 2.2 22000 1.1 24000 1.1 26000 5.1 20000 7.9 10.6 12.7 5.2 2.8 17000 6.3 2.6 17000 6.5 1.2 18000 8.9 1.2 20000 9.6 Production 3.5 14000 5.5 1.2 16000 8.1 1.1 18000 10.0 1.1 20000 12.0 2.2 23000 8.9 1.9 25000 12.1 1.0 23000 10.5 1.0 25000 12.5 12.2 $32.00 7.6 $40.00 9.6 $42.00 14.9 $26.00 13.8 $19.00 13.6 $19.00 10.8 $27.00 11.3 $28.00 14.6 $20.00 12.0 $22.00 8.3 $31.00 10.1 $35.00 Material Labor Contr. Cost Cost Marg. $11.60 $8.96 35% 50% $16.13 $10.29 33% 42% $16.81 $9.80 36% 22% $8.13 $7.90 33% 90% 2nd Auto Shift & mation Capacity Over- Next Next Plant time Round Round Utiliz. $6.65 $2.82 $10.01 $5.64 $13.64 $6.24 $14.36 $7.09 33% 8.0 $8.40 $4.03 41% $8.61 $4.22 37% 57% 8.0 $11.68 $7.38 30% 93% 6.0 $12.39 $7.38 30% 93% 6.0 5.0 4.0 4.0 6.0 9.4 $30.00 $13.98 $9.50 25% 10.2 $38.00 $15.87 $7.73 41% 7.6 $37.00 $15.79 $8.50 34% 9.6 $39.00 $16.39 $7.95 37% 51% 100% 9.0 31% 100% 7.0 36% 25% 6.0 38% 8% 5.0 93% 5.0 0% 5.0 27% 5.0 6% 5.0 1,200 149% 728 141% 714 121% 1,130 188% 1,050 132% 1,250 155% 900 191% 950 191% 1,000 198% 1,150 198% 750 124% 800 107% 570 191% 700 64% 850 125% 950 105% ROS Asset Turnover ROA Leverage (Assets/Equity) ROE Emergency Loan Sales EBIT Profits Cumulative Profit SG&A / Sales Contrib. Margin % 100% 90% 80% 70% 60% 50% 40% 30% 20% 10% 0% Andrews Percent of Sales Baldwin Selected Financial Statistics Baldwin Andrews 12.3% 5.7% 1.32 0.91 16.3% 5.2% 1.7 2.7 28.3% 13.7% $0 $0 $163,405,682 $36,465,763 $20,139,267 Chester $0 7.9% 34.1% Digby $131,627,447 $21,737,197 $7,499,948 $0 9.7% 33.8% Profit Other SGA Depr Var Costs Chester 8.6% 0.94 8.1% 2.4 19.2% $0 $118,809,302 $23,745,048 $10,189,632 $0 11.2% 38.8% Digby 9.2% 1.27 11.8% 1.9 22.4% $0 $119,585,004 $21,603,263 $11,056,951 $ Market Share $0 10.3% 33.3% Andrews 30.63 % Baldwin 24.68 % Chester 22.27 % Digby 22.42 %
Step by Step Solution
3.42 Rating (149 Votes )
There are 3 Steps involved in it
Step: 1
Calculation of Minimum price is as below Minimum pr...
Get Instant Access to Expert-Tailored Solutions
See step-by-step solutions with expert insights and AI powered tools for academic success
Step: 2

Step: 3

Ace Your Homework with AI
Get the answers you need in no time with our AI-driven, step-by-step assistance
Get Started


