Answered step by step
Verified Expert Solution
Question
1 Approved Answer
The comparative statements of Painter Tool Company are presented below. All sales were on account. Compute the following ratios for 2015. (Weighted-average common shares in
The comparative statements of Painter Tool Company are presented below.
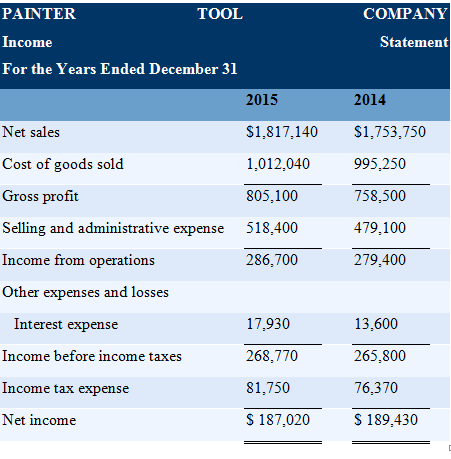
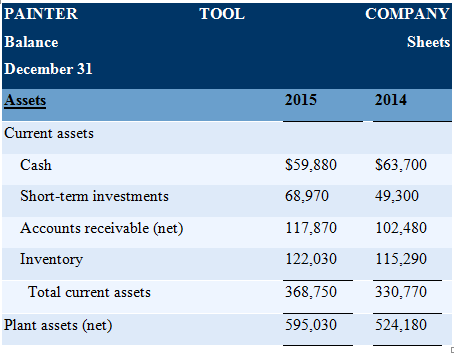
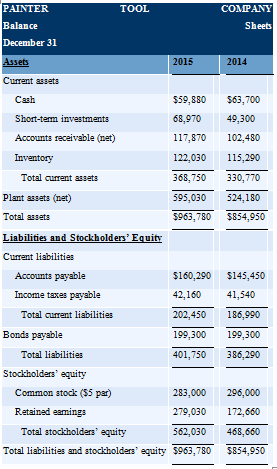
All sales were on account.
Compute the following ratios for 2015. (Weighted-average common shares in 2015 were 51,700.) (Round Earnings per share, Current ratio and Acid-test ratio to 2 decimal places, e.g.1.65 or 1.65: 1, and all other answers to 1 decimal place, e.g. 6.8 or 6.8% .)
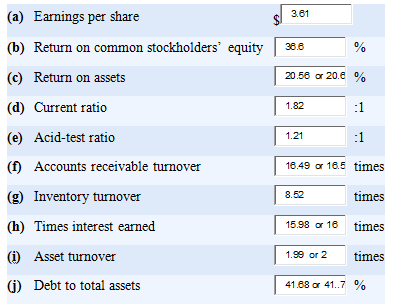
Detailed explanation of the calculations is as given below:
PAINTER Income For the Years Ended December 31 TOOL Net sales Cost of goods sold Gross profit Selling and administrative expense Income from operations Other expenses and losses Interest expense Income before income taxes Income tax expense Net income 2015 $1,817,140 1,012,040 805,100 518,400 286,700 17,930 268,770 81,750 $ 187,020 COMPANY Statement 2014 $1,753,750 995,250 758,500 479,100 279,400 13,600 265,800 76,370 $ 189,430 PAINTER Balance December 31 Assets Current assets Cash Short-term investments Accounts receivable (net) Inventory Total current assets Plant assets (net) TOOL 2015 COMPANY Sheets 2014 $59,880 $63,700 68,970 49,300 117,870 102,480 122,030 115,290 368,750 330,770 595,030 524,180 PAINTER Balance December 31 Assets Current assets Cash Short-term investments Accounts receivable (net) Inventory Total current assets Plant assets (net) Total assets Liabilities and Stockholders' Equity Current liabilities Accounts payable Income taxes payable Total current liabilities Bonds payable TOOL Total liabilities Stockholders' equity 2015 COMPANY Sheets 2014 $59,880 $63,700 68,970 49,300 117,870 102,480 122,030 115,290 368,750 330,770 595,030 524,180 $963,780 $854,950 Common stock ($5 par) Retained eamings Total stockholders' equity 562,030 Total liabilities and stockholders' equity $963,780 $160,290 42,160 41,540 202,450 186,990 199,300 199,300 401,750 386,290 $145,450 283,000 296,000 279,030 172,660 468,660 $854,950 (a) Earnings per share (b) Return on common stockholders' equity (c) Return on assets (d) Current ratio (e) Acid-test ratio (f) Accounts receivable turnover (g) Inventory turnover (h) Times interest earned (i) Asset turnover (j) Debt to total assets 3.61 38.6 20.58 or 20.8 % 1.82 :1 :1 16.49 or 16.5 times. 1.21 % 8.52 times 15.98 or 16 times times 1.99 or 2 41.68 or 41..7 %
Step by Step Solution
★★★★★
3.40 Rating (153 Votes )
There are 3 Steps involved in it
Step: 1
a Earnings per share Earnings per Share Net Income Preferred Dividends Outstanding Common Shares So ...
Get Instant Access to Expert-Tailored Solutions
See step-by-step solutions with expert insights and AI powered tools for academic success
Step: 2

Step: 3

Ace Your Homework with AI
Get the answers you need in no time with our AI-driven, step-by-step assistance
Get Started


