Question
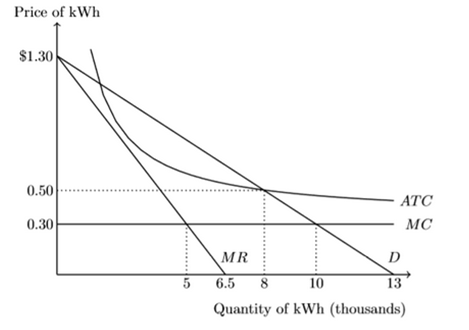
The diagram below illustrates your local electricity company's natural monopoly. It shows the demand curve for kilowatt-hours (kWh) of electricity, the company's marginal revenue (MR)
The diagram below illustrates your local electricity company's natural monopoly. It shows the demand curve for kilowatt-hours (kWh) of electricity, the company's marginal revenue (MR) curve, its marginal cost (MC) curve, and its average total cost (ATC) curve. The government wants to regulate the monopolist by imposing a price ceiling.

(a) If the government does not regulate this monopolist, which price will it charge? Illustrate the inefficiency this creates by shading the deadweight loss from monopoly.
(b) If the government imposes a price ceiling equal to the marginal cost, $0.30, will the monopolist make profits or lose money? Shade the area of profit (or lewd for the monopolist. If the government does impose this price ceiling, do you think the firm will continue to produce in the long run?
(c) If the government imposes a price ceiling of $0.50, will the monopolist make a profit, lose money, or break even?
Price of kWh $1.30 0.50 0.30 5 MR ATC MC 6.5 D 13 8 10 Quantity of kWh (thousands)
Step by Step Solution
3.35 Rating (155 Votes )
There are 3 Steps involved in it
Step: 1
a A monopolist produces at a point of intersection of MR mc charges price consumer are willing to p...
Get Instant Access to Expert-Tailored Solutions
See step-by-step solutions with expert insights and AI powered tools for academic success
Step: 2

Step: 3

Document Format ( 2 attachments)
6095afec6f977_26137.pdf
180 KBs PDF File
6095afec6f977_26137.docx
120 KBs Word File
Ace Your Homework with AI
Get the answers you need in no time with our AI-driven, step-by-step assistance
Get Started


