Question: IVEy | Publishing W32285 GOODYEAR TIRE & RUBBER: M&A SYNERGIES O Mark Simonson wrote this case solely to provide material for class discussion. The author
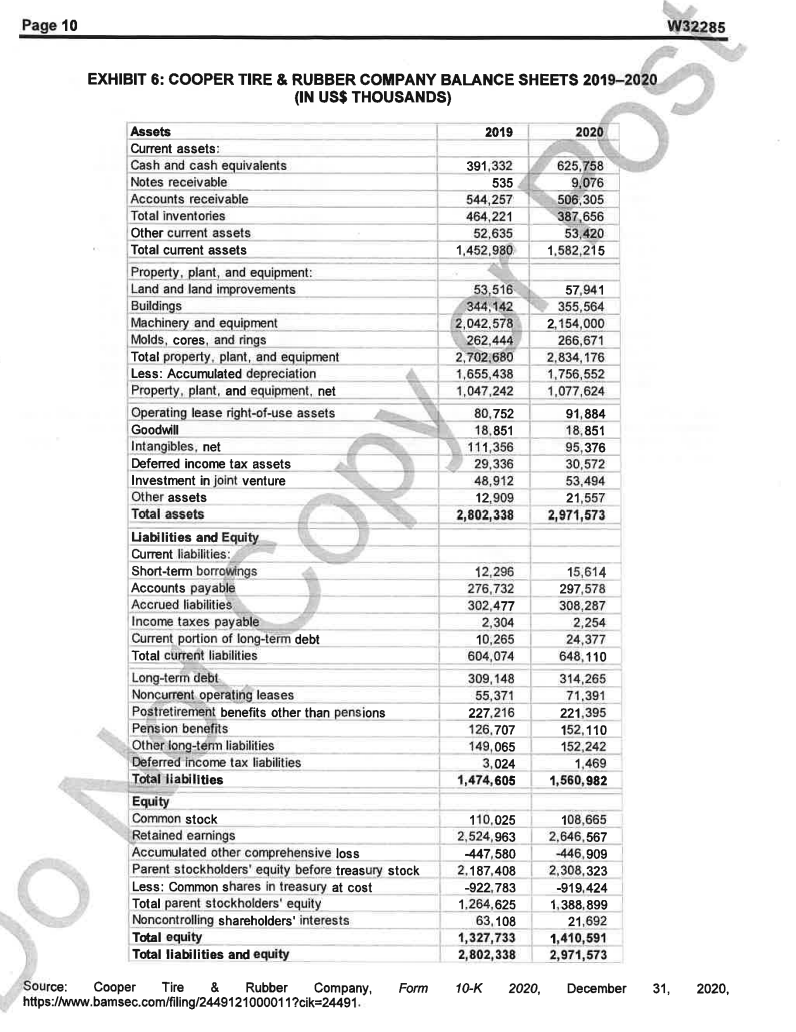
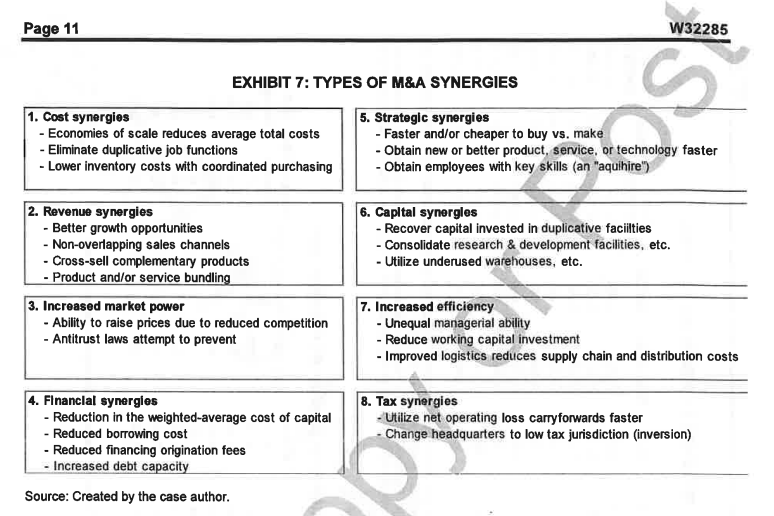
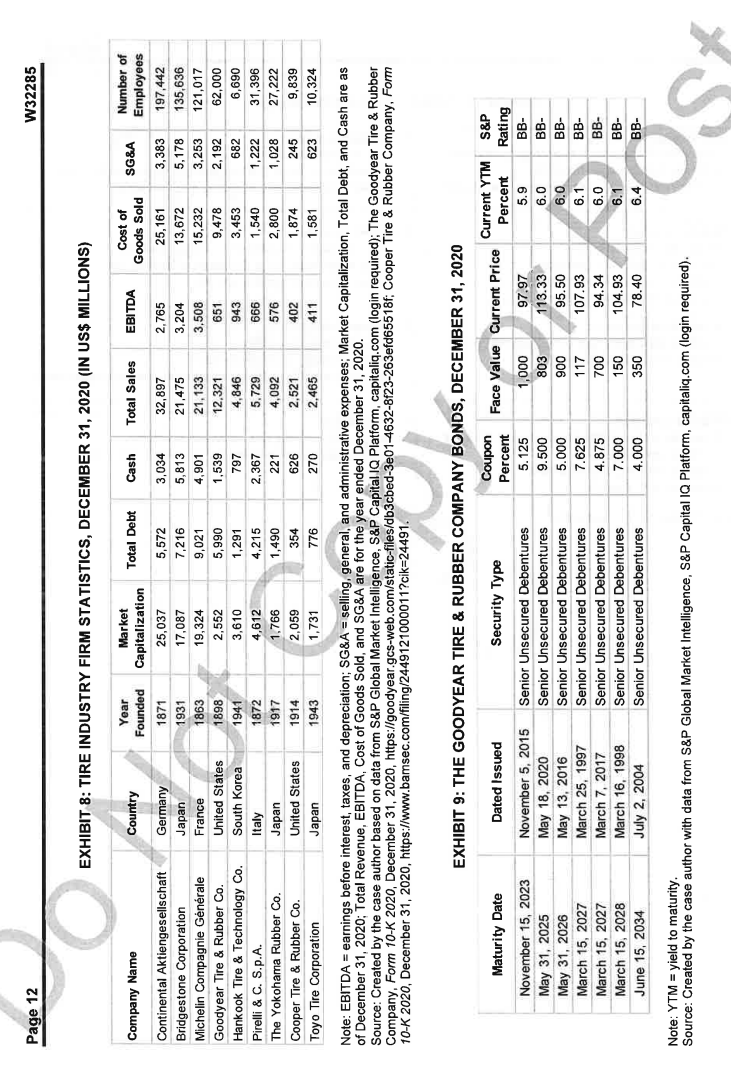
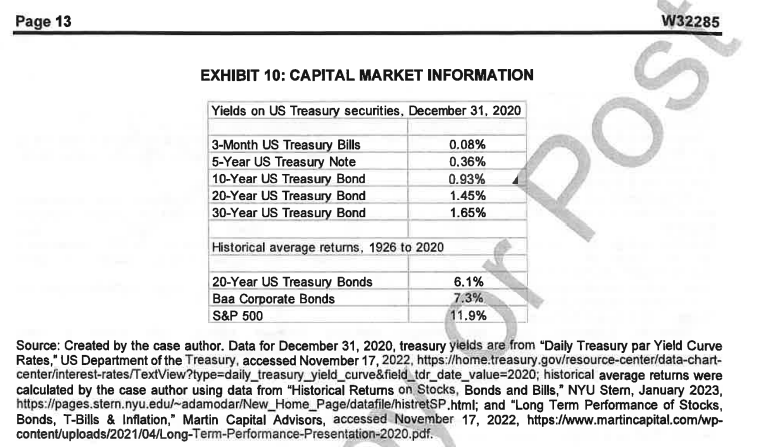
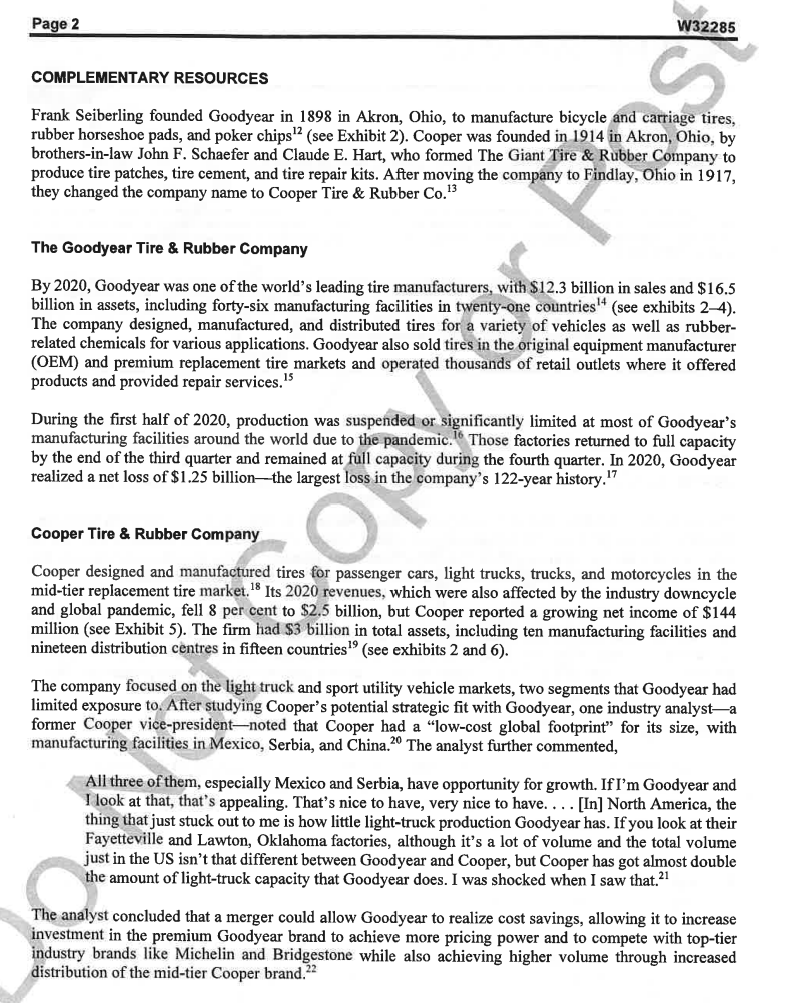
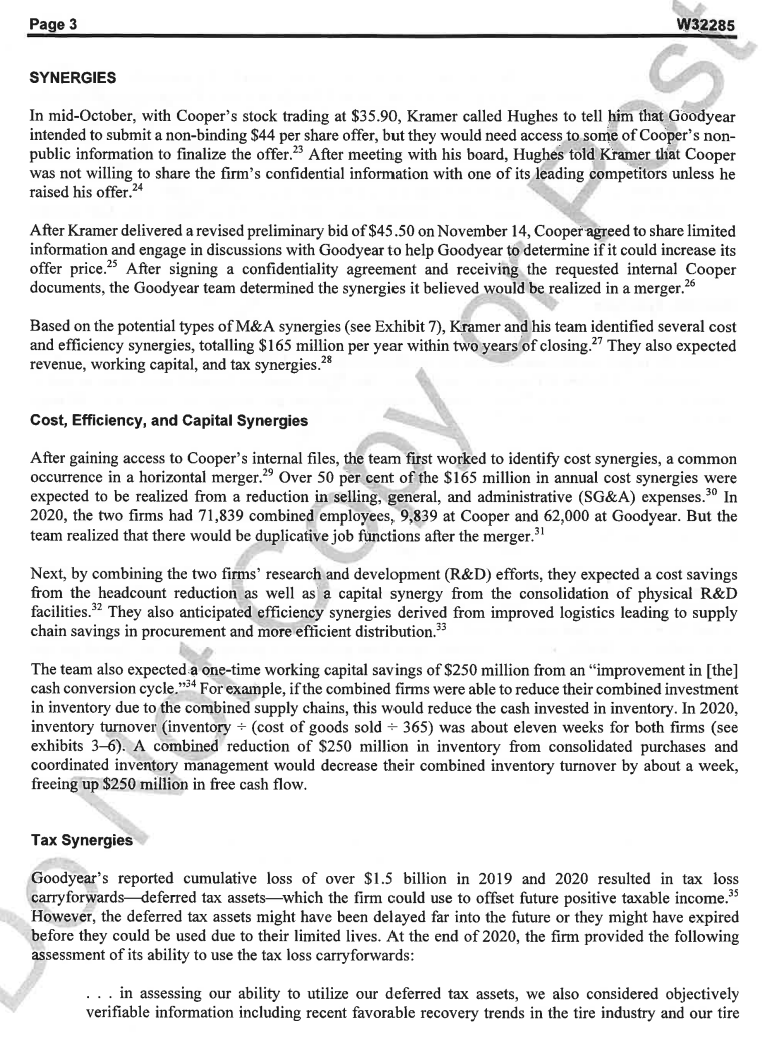
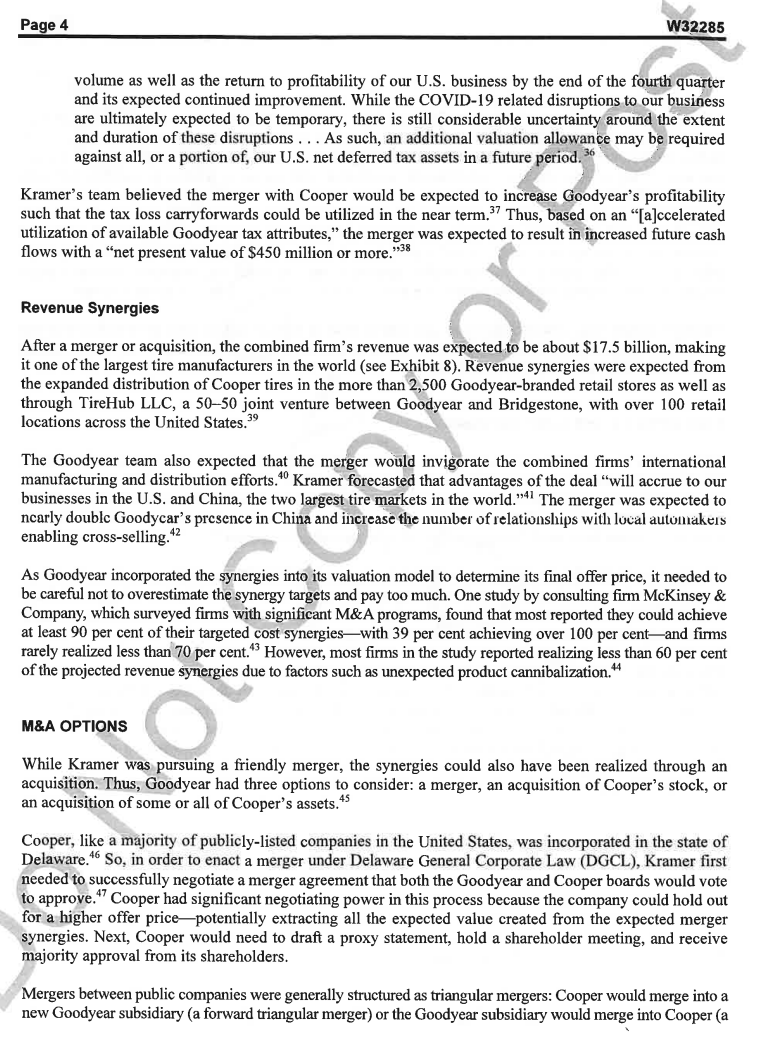
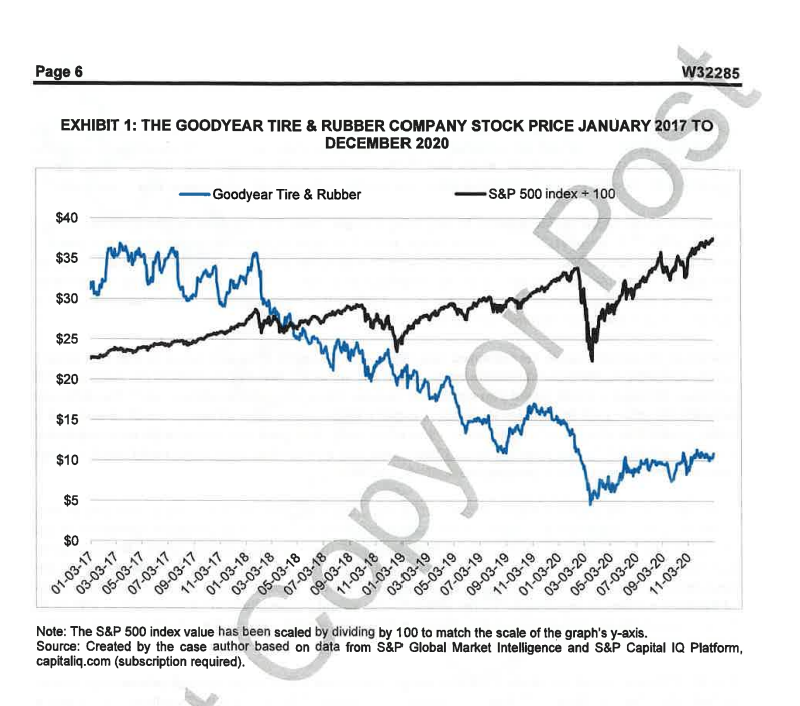
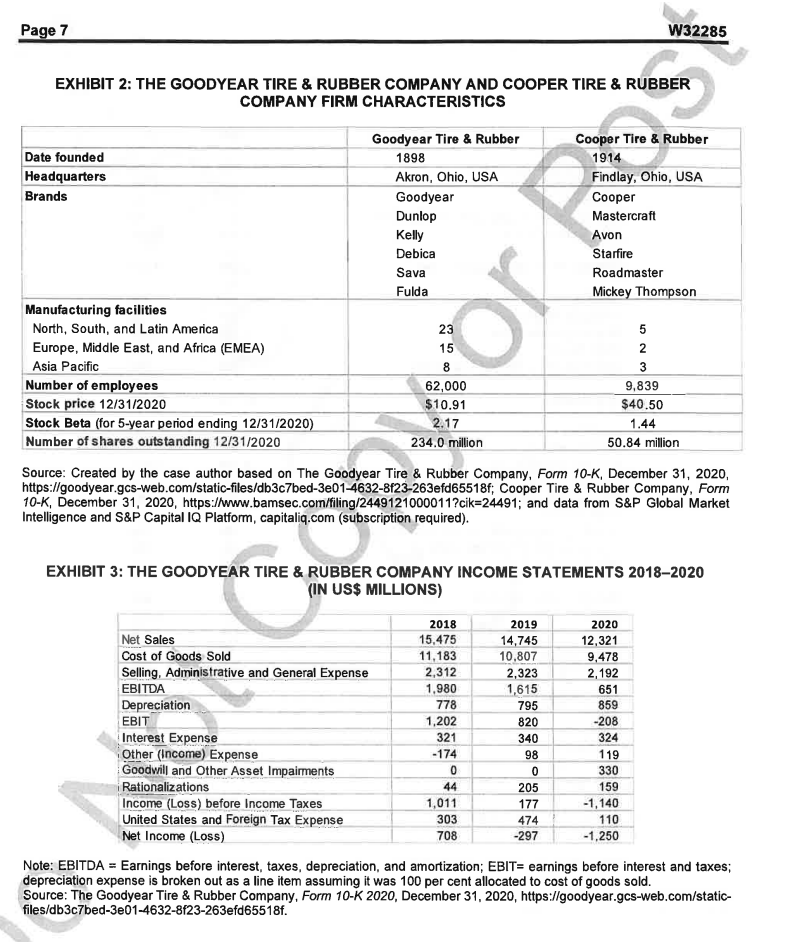
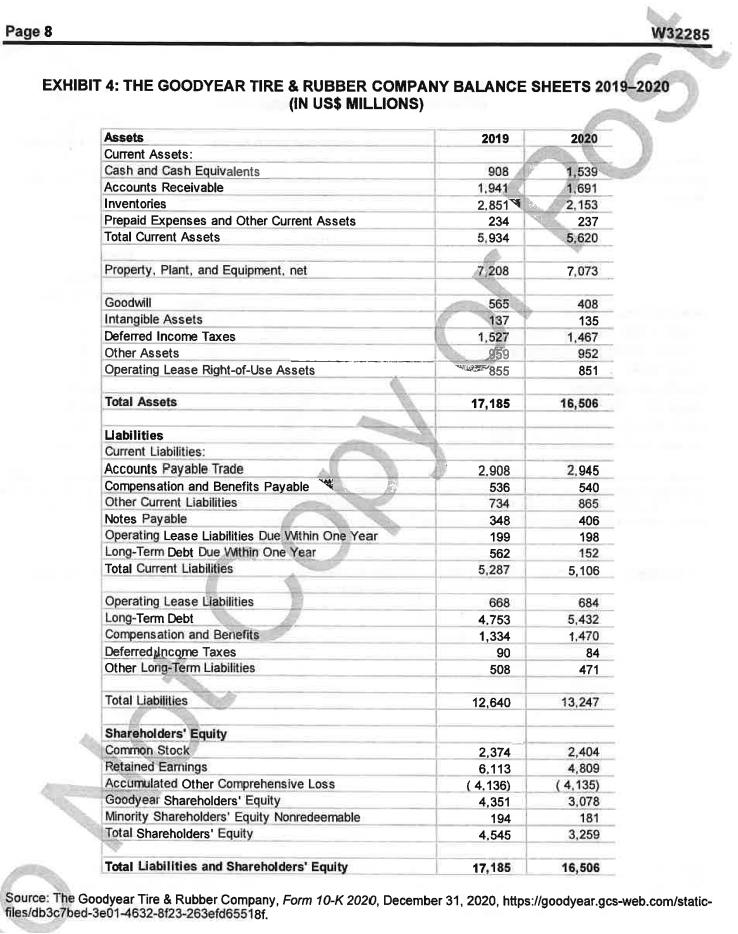
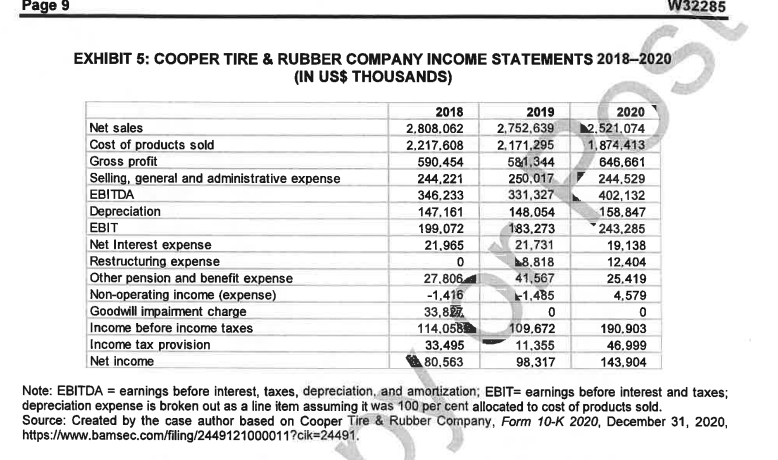
IVEy | Publishing W32285 GOODYEAR TIRE & RUBBER: M&A SYNERGIES O Mark Simonson wrote this case solely to provide material for class discussion. The author does not intend to illustrate either effective or ineffective handling of a managerial situation. The authors may have disguised certain names and other identifying information to protect confidentiality. This publication may not be transmitted, photocopied, digitized, or otherwise reproduced in any form or by any means without the permission of the copyright holder. Reproduction of this material is not covered under authorization by any reproduction rights organization. To order copies or request permission to reproduce materials, contact Ivey Publishing, Ivey Business School, Western University, London, Ontario, Canada, NG ON1; (t) 519.661.3208; (e) cases@ivey.ca; www.iveycases.com. Our goal is to publish materials of the highest quality; submit any errata to publishcases@ivey.ca. Copyright @ 2023, Ivey Business School Foundation In late 2020, The Goodyear Tire & Rubber Company (Goodyear) chief executive officer, Richard Kramer, and Cooper Tire & Rubber Company (Cooper) chief executive officer, Bradley Hughes, met over dinner. Their two firms had much in common-both were founded over 100 years ago in Akron, Ohio, and they were the two largest US tire manufacturers-so the two men met to discuss general industry conditions." During the meal, Kramer asked if Hughes was willing to consider an acquisition proposal from Goodyear.' Hughes, who was paid over $6 million per year to lead Cooper, explained that his company was "not for sale" and that he was optimistic about Cooper's "standalone strategy." He acknowledged, however, that the Cooper board always considered offers that were in the best interests of its stockholders. A few weeks later, Kramer called Hughes and told him to expect an offer by the end of the year." Goodyear had been the target of a disruptive hostile takeover attempt in the past, and Kramer hoped that Cooper would be open to a friendly offer." So, along with Goodyear chief financial officer, Darren Wells, and financial advisor, Lazard Freres, & Co., LLC, Kramer set out to identify potential synergies and prepare on offer." DOWNCYCLE Goodyear realized a net loss of over $1.5 billion in 2019-2020 as it endured global weakness in the automotive industry and the onset of the worldwide COVID-19 pandemic. The company's stock was fluctuating around $10, which was off its March 18, 2020 low of $4.57 during the height of pandemic fear in the stock market, but about 70 per cent below its high of $35 in 2018 (see Exhibit 1). Kramer attributed the stock's decline to industry cycles. "Now that we are in another industry downcycle," he stated, "the second of my tenure and the third of my career at Goodyear, it's clear that our long-term approach is the right one. Our conviction in that philosophy is unwavering." Amid the downturn, one analyst speculated that a merger between Goodyear and Cooper could "act as a pit stop" providing vital cost and revenue synergies. " Goodyear had used mergers and acquisitions (M&As) to achieve scale and fuel its growth in the past, so Kramer's team needed to decide if acquiring Cooper could help both companies weather the downcycle and emerge stronger together."Page 10 W32285 EXHIBIT 6: COOPER TIRE & RUBBER COMPANY BALANCE SHEETS 2019-2020 (IN US$ THOUSANDS) Assots 2019 2020 Current assets: Cash and cash equivalents 391,332 Notes receivable 536 4 Accounts receivable 544,257 | Total inventories 464,221 Other current assets 52,635 424 Total current assets 1,452,980 1,582,215 Property, plant, and equipment: Land and land improvements 53,516 57,941 Buildings 244142 355,564 Machinery and equipment (2,042578 2,154,000 | Molds, cores, and rings 262,444 266,671 Total property, plant, and equipment 2,702,680 2,834,176 Less: Accumulated depreciation 1,655,438 1,756,552 Property, plant, and equipment, net & 1,047,242 1,077,624 Operating lease right-of-use assets e 9 80,752 91,884 Goodwill { 18,851 18,851 Intangibles, net 8 e o 111,356 95,376 Defered income tax assets 4 29,336 30,572 Investment in joint venture 4 48,912 53,494 Other assets 12,909 21,857 Total assets i 2,802,338 2,971,573 Liabilities and Equity Current liabilities: - - Short-term borrowings g 12,296 15,614 Accounts payable 276,732 297,578 Accrued liabilities 302,477 308,287 Income taxes payable 2,304 2,254 Current portion of long-term debt 10,265 24,377 Total current liabilities 604,074 648,110 Long-term debt 309,148 314,265 Noncurrent operaling leases 55,371 71.391 Postretirement benefits other than pensions 227,216 221,395 Pengion benefils 126,707 152,110 Other long-term liabilities 149,065 152,242 Deferred income tax liabilities 3,024 1.489 Total liabilities 1,474,605 1,560,982 Equity Common stock 110,025 108,665 Retained earnings 2,524,963 2,646,567 Accumulated other comprehensive loss -447,580 -446,909 Parent stockholders' equity before treasury stock 2.187.408 2,308,323 Less: Common shares in treasury at cost -922,783 -919,424 Total parent stockholders' equity 1.264,625 1,388,899 Noncontrolling shareholders' interests 63,108 21,692 Total equity 1,327,733 1,410,591 Total liabilities and equity 2,802,338 2,971,573 Source: Cooper Tire & Rubber Company, Form 10-K 2020, December 31, 2020, hitps:/iwww.bamsec.com/filing/24491210000112ik=24491. Page 11 W32285 EXHIBIT 7: TYPES OF M&A SYNERGIES 1. Cost synergies 5. Strategic synergies - Economies of scale reduces average total costs - Faster and/or cheaper to buy vs. make - Eliminate duplicative job functions - Obtain new or better product, service, or technology faster - Lower inventory costs with coordinated purchasing - Obtain employees with key skills (an "aquihire") 2. Revenue synergies 6. Capital synergles - Better growth opportunities - Recover capital invested in duplicative facilties - Non-overlapping sales channels - Consolidate research & development facilities, etc. - Cross-sell complementary products - Utilize underused warehouses, etc. - Product and/or service bundling 3. Increased market power 7. Increased efficiency - Ability to raise prices due to reduced competition - Unequal managerial ability - Antitrust laws attempt to prevent - Reduce working capital investment - Improved logistics reduces supply chain and distribution costs 4. Financial synergies 8. Tax synergies Reduction in the weighted-average cost of capital - Utilize net operating loss carryforwards faster - Reduced borrowing cost Change headquarters to low tax jurisdiction (inversion) - Reduced financing origination fees Increased debt capacity Source: Created by the case author.Page 12 W32285 O EXHIBIT 8: TIRE INDUSTRY FIRM STATISTICS, DECEMBER 31, 2020 (IN US$ MILLIONS) Year Market Cost of EBITDA SG&A Number of Company Name Country Total Debt Cash Total Sales Founded Capitalization Goods Sold Employees Continental Aktiengesellschaft Germany 1871 25,037 5,572 3,034 32,897 2,765 25, 161 3,383 197,442 Bridgestone Corporation Japan 1931 17,087 7,216 5,813 21,475 3,204 13,672 5,178 135,636 Michelin Compagnie Generale France 1863 19,324 9,021 4,901 21, 133 3,508 15,232 3,253 121,017 Goodyear Tire & Rubber Co. United States 1898 2,552 5,990 1,539 12.321 651 9,478 2,192 62,000 Hankook Tire & Technology Co. South Korea 1941 3,610 1,291 797 4.846 943 3,453 682 6,690 Pirelli & C. S.p.A. Italy 1872 4,612 4,215 2,367 5.729 666 1,540 1,222 31,396 The Yokohama Rubber Co. Japan 1917 1,766 1,490 221 4,092 576 2,800 1,028 27,222 Cooper Tire & Rubber Co. United States 1914 2,059 354 626 2,521 402 1,874 245 9,839 Toyo Tire Corporation Japan 1943 1,731 776 270 2.465 1,581 623 10,324 Note: EBITDA = earnings before interest, taxes, and depreciation; SG&A = selling, general, and administrative expenses; Market Capitalization, Total Debt, and Cash are as of December 31, 2020; Total Revenue, EBITDA, Cost of Goods Sold, and SG&A are for the year ended December 31, 2020 Source: Created by the case author based on data from S&P Global Market Intelligence, S&P Capital IQ Platform, capitaliq.com (login required); The Goodyear Tire & Rubber Company, Form 10-K 2020, December 31, 2020, https://goodyear.gcs-web.com/static-files/db3cbed-3e01-4632-8f23-263efd65518f; Cooper Tire & Rubber Company, Form 10-K 2020, December 31, 2020, https://www.bamsec.com/filing/2449121000011?cik=24491 EXHIBIT 9: THE GOODYEAR TIRE & RUBBER COMPANY BONDS, DECEMBER 31, 2020 Current YTM S&P Security Type Coupon Maturity Date Dated Issued Percent Face Value Current Price Percent Rating November 15, 2023 November 5, 2015 Senior Unsecured Debentures 5. 125 1,000 97.97 5.9 BB- May 31, 2025 May 18, 2020 Senior Unsecured Debentures 9.500 803 113.33 BB- May 31, 2026 May 13, 2016 Senior Unsecured Debentures 5.000 900 95.50 BB March 15, 2027 March 25, 1997 Senior Unsecured Debentures 7.625 107.93 BB March 15, 2027 March 7, 2017 Senior Unsecured Debentures 4.875 94.34 6.0 BB- March 15, 2028 March 16, 1998 Senior Unsecured Debentures 7.000 104.93 BB- June 15, 2034 July 2, 2004 Senior Unsecured Debentures 4.000 350 78.40 BB- Note: YTM = yield to maturity. Source: Created by the case author with data from S&P Global Market Intelligence, S&P Capital IQ Platform, capitaliq.com (login required).Page 13 W32285 EXHIBIT 10: CAPITAL MARKET INFORMATION Yields on US Treasury securities, December 31, 2020 3-Month US Treasury Bills 0.08% O 5-Year US Treasury Note 0.36% 10-Year US Treasury Bond 0.93% 20-Year US Treasury Bond 1.45% 30-Year US Treasury Bond 1.65% Historical average returns, 1926 to 2020 20-Year US Treasury Bonds 6.1% Baa Corporate Bonds 7.3% S&P 500 11.9% Source: Created by the case author. Data for December 31, 2020, treasury yields are from "Daily Treasury par Yield Curve Rates," US Department of the Treasury, accessed November 17, 2022, https://home.treasury.gov/resource-center/data-chart- center/interest-rates/TextView?type=daily_treasury_yield_curve&field_tdr_date_value=2020; historical average returns were calculated by the case author using data from "Historical Returns on Stocks, Bonds and Bills," NYU Stem, January 2023, https://pages.stern.nyu.edu/~adamodar/New_Home_Page/datafile/histretSP.html; and "Long Term Performance of Stocks, Bonds, T-Bills & Inflation," Martin Capital Advisors, accessed November 17, 2022, https://www.martincapital.com/wp- content/uploads/2021/04/Long-Term-Performance-Presentation-2020.pdf.Page 2 W32285 COMPLEMENTARY RESOURCES Frank Seiberling founded Goodyear in 1898 in Akron, Ohio, to manufacture bicycle and carriage tires, rubber horseshoe pads, and poker chips" (see Exhibit 2). Cooper was founded in 1914 in Akron, Ohio, by brothers-in-law John F. Schaefer and Claude E. Hart, who formed The Giant Tire & Rubber Company to produce tire patches, tire cement, and tire repair kits. After moving the company to Findlay, Ohio in 1917, they changed the company name to Cooper Tire & Rubber Co." The Goodyear Tire & Rubber Company By 2020, Goodyear was one of the world's leading tire manufacturers, with $12.3 billion in sales and $16.5 billion in assets, including forty-six manufacturing facilities in twenty-one countries * (see exhibits 2-4). The company designed, manufactured, and distributed tires for a variety of vehicles as well as rubber- related chemicals for various applications. Goodyear also sold tires in the original equipment manufacturer (OEM) and premium replacement tire markets and operated thousands of retail outlets where it offered products and provided repair services. During the first half of 2020, production was suspended or significantly limited at most of Goodyear's manufacturing facilities around the world due to the pandemic. Those factories returned to full capacity by the end of the third quarter and remained at full capacity during the fourth quarter. In 2020, Goodyear realized a net loss of $1.25 billion-the largest loss in the company's 122-year history."" Cooper Tire & Rubber Company Cooper designed and manufactured tires for passenger cars, light trucks, trucks, and motorcycles in the mid-tier replacement tire market. " Its 2020 revenues, which were also affected by the industry downcycle and global pandemic, fell 8 per cent to $2.5 billion, but Cooper reported a growing net income of $144 million (see Exhibit 5). The firm had $3 billion in total assets, including ten manufacturing facilities and nineteen distribution centres in fifteen countries (see exhibits 2 and 6). The company focused on the light truck and sport utility vehicle markets, two segments that Goodyear had limited exposure to. After studying Cooper's potential strategic fit with Goodyear, one industry analyst-a former Cooper vice-president-noted that Cooper had a "low-cost global footprint" for its size, with manufacturing facilities in Mexico, Serbia, and China." The analyst further commented, All three of them, especially Mexico and Serbia, have opportunity for growth. If I'm Goodyear and I look at that, that's appealing. That's nice to have, very nice to have. . . . [In] North America, the thing that just stuck out to me is how little light-truck production Goodyear has. If you look at their Fayetteville and Lawton, Oklahoma factories, although it's a lot of volume and the total volume just in the US isn't that different between Goodyear and Cooper, but Cooper has got almost double the amount of light-truck capacity that Goodyear does. I was shocked when I saw that.? The analyst concluded that a merger could allow Goodyear to realize cost savings, allowing it to increase investment in the premium Goodyear brand to achieve more pricing power and to compete with top-tier industry brands like Michelin and Bridgestone while also achieving higher volume through increased distribution of the mid-tier Cooper brand.??Page 3 W32285 SYNERGIES In mid-October, with Cooper's stock trading at $35.90, Kramer called Hughes to tell him that Goodyear intended to submit a non-binding $44 per share offer, but they would need access to some of Cooper's non- public information to finalize the offer. After meeting with his board, Hughes told Kramer thiat Cooper was not willing to share the firm's confidential information with one of its leading competitors unless he raised his offer.?* After Kramer delivered a revised preliminary bid of $45.50 on November 14, Cooper-agreed to share limited information and engage in discussions with Goodyear to help Goodyear to determine if it could increase its offer price." After signing a confidentiality agreement and receiving the requested internal Cooper documents, the Goodyear team determined the synergies it believed would be realized in a merger." Based on the potential types of M&A synergies (see Exhibit 7), Kramer and his team identified several cost and efficiency synergies, totalling $165 million per year within two years of closing."' They also expected revenue, working capital, and tax synergies. Cost, Efficiency, and Capital Synergies After gaining access to Cooper's internal files, the team first worked to identify cost synergies, a common occurrence in a horizontal merger.?" Over 50 per cent of the $165 million in annual cost synergies were expected to be realized from a reduction in selling, general, and administrative (SG&A) expenses.'" In 2020, the two firms had 71,839 combined employees, 9,839 at Cooper and 62,000 at Goodyear. But the team realized that there would be duplicative job functions after the merger."' Next, by combining the two firms research and development (R&D) efforts, they expected a cost savings from the headcount reduction as well as a capital synergy from the consolidation of physical R&D facilities.*? They also anticipated efficiency synergies derived from improved logistics leading to supply chain savings in procurement and more efficient distribution." The team also expected-a one-time working capital savings of $250 million from an "improvement in [the] cash conversion cycle."** For example, if the combined firms were able to reduce their combined investment in inventory due to the combined supply chains, this would reduce the cash invested in inventory. In 2020, inventory turnover (inventory + (cost of goods sold + 365) was about eleven weeks for both firms (see exhibits 3-6). A combined reduction of $250 million in inventory from consolidated purchases and coordinated inventory management would decrease their combined inventory turnover by about a week, freeing up $250 million in free cash flow. Tax Synergies Goodyear's reported cumulative loss of over $1.5 billion in 2019 and 2020 resulted in tax loss carryforwardsdeferred fax assetswhich the firm could use to offset future positive taxable income." However, the deferred tax assets might have been delayed far into the future or they might have expired before they could be used due to their limited lives. At the end of 2020, the firm provided the following assessment of its ability to use the tax loss carryforwards: . in assessing our ability to utilize our deferred tax assets, we also considered objectively verifiable information including recent favorable recovery trends in the tire industry and our tire Page 4 W32285 - .- - volume as well as the return to profitability of our U.S. business by the end of the fourth quarter and its expected continued improvement. While the COVID-19 related disruptions to our business are ultimately expected to be temporary, there is still considerable uncertainty around the extent and duration of these disruptions . . . As such, an additional valuation allowance may be required against all, or a portion of, our U.S. net deferred tax assets ina future penorl Kramer's team believed the merger with Cooper would be expected to increase Gaodyea:'s profitability such that the tax loss carryforwards could be utilized in the near term."" Thus, based on an "[a]ccelerated utilization of available Goodyear tax attributes," the merger was expected to result in increased future cash flows with a "net present value of $450 million or more.""* Revenue Synergies After a merger or acquisition, the combined firm's revenue was expected to be about $17.5 billion, making it one of the largest tire manufacturers in the world (see Exhibit 8). Revenue synergies were expected from the expanded distribution of Cooper tires in the more than 2,500 Goodyear-branded retail stores as well as through TireHub LLC, a 50-50 joint venture between Goodyear and Bridgestone, with over 100 retail locations across the United States. The Goodyear team also expected that the merger would invigorate the combined firms' international manufacturing and distribution efforts." Kramer forecasted that advantages of the deal "will accrue to our businesses in the U.S. and China, the two largest tire markets in the world.""' The merger was expected to nearly double Gnodycar s presence in China and increase the number of relationships with local autonakers enabling cross-selling.*? As Goodyear incorporated the synergies into its valuation model to determine its final offer price, it needed to be careful not to overestimate the synergy targets and pay too much. One study by consulting firm McKinsey & Company, which surveyed firms with significant M&A programs, found that most reported they could achieve at least 90 per cent of their targeted cost synergieswith 39 per cent achieving over 100 per centand firms rarely realized less than 70 per cent." However, most firms in the study reported realizing less than 60 per cent of the projected revenue synergies due to factors such as unexpected product cannibalization." M&A OPTIONS While Kramer was pursuing a friendly merger, the synergies could also have been realized through an acquisition. Thus, Goodyear had three options to consider: a merger, an acquisition of Cooper's stock, or an acquisition of some or all of Cooper's assets.* Cooper, like a majority of publicly-listed companies in the United States, was incorporated in the state of Delaware.* So, in order to enact a merger under Delaware General Corporate Law (DGCL), Kramer first needed to successfully negotiate a merger agreement that both the Goodyear and Cooper boards would vote to approve.'" Cooper had significant negotiating power in this process because the company could hold out for'a higher offer pricepotentially extracting all the expected value created from the expected merger synergies. Next, Cooper would need to draft a proxy statement, hold a shareholder meeting, and receive majority approval from its shareholders. Mergers between public companies were generally structured as triangular mergers: Cooper would merge into a new Goodyear subsidiary (a forward triangular merger) or the Goodyear subsidiary would merge into Cooper (a Page W32285 reverse triangular merger). Under DGCL, since the "constituent corporations" would be Cobperand the Goodyear subsidiary, and not the subsidiary's parent Goodyear, there would be no requirement to receive majority approval from Goodyear shareholders." However, since the average time from a signed merger agreement to a target stockholder vote was about four months, mergers took considerable time to complete.*" Goodyear could speed up the process by acquiring Cooper stock directly from its stockholders using a "tender offer."*" In a tender offer, Goodyear would provide an offer to purchase Cooper shares at a specified offer price and stockholders could tender their shares to receive the merger consideration. Tender offers did not require a stockholder vote and could be completed in as few as twenty days."' As long as Goodyear obtained at least 90 per cent of Cooper shares in the tender offer, then Goodyear could enact a "short-form merger," which would not require a stockholder vote. Goodyear could also realize the increased cash flows and synergies by acquiring all or part of Cooper's assets, including its thirteen manufacturing facilities and six major brands (see Exhibit 2). Acquiring 100 per cent of Cooper's assets would also potentially provide Goodyear with tax advantages. The difference between the price paid for Cooper stock and Cooper's former book value of equity could be assigned to either goodwill or a higher"stepped up"value of its assets. Any goodwill created in the asset acquisition could be amortized for tax purposes over fifteen years, and a stepped-up asset basis could result in larger future depreciation expenses, creating valuable tax shields. However, for large public companies such as Cooper, asset acquisitions were rarely used due to their complexity and negative tax effects for the target sharsholders."" An asset purchase agreement would require listing and assigning values to each asset acquired, from furniture to real estate. Determining the fair value of each asset acquired was complicated and expensive and other expenses such as title transfer taxes may have been incurred. It also might have been difficult to transfer certain assets without the consent of business partners or regulators. Finally, an assets sale would potentially have detrimental tax affects for Cooper shareholders: Cooper would have to pay a tax on the capital gain on the sale of its assets and then Cooper shareholders would have to pay a tax on a liquidating dividend. Finally, if Kramer could not reach a friendly merger agreement with Cooper through private negotiations, he had other "hostile" options.* First, he could send a so-called "bear hug letter" outlining the proposed merger terms and putting pressure on the board by releasing the letter to the public. He could also enact a hostile takeover by proceeding with a tender offer without Cooper's consent. In the 1980s, hostile takeover attempts were common. However, the number of hostile takeover attempts decreased in the following decades, and by 2020, hostile takeovers were rare. "A REVISED PROPOSAL OR OTHER UPDATE" Goodyear was considering using a combination of debt, stock, and cash to finance the transaction." To avoid earnings per share dilution from issuing too many shares as merger consideration, the company was working with financial advisor J.P. Morgan to secure up to $2.314 billion of new debt financing *" The firm already had substantial leverage, including over $4 billion of BB-rated senior unsecured debentures yielding more than 5 per cent above US Treasuries (see exhibits 9 and 10). On December 18, 2020, Kramer informed Hughes that "Goodyear was still working on a revised proposal based on" its recent discussions with Cooper representatives and the new information that had been provided.* He said that his team would continue to evaluate its revised proposal over the year-end holidays to provide "a revised proposal or other update" in January 2021.% Page 6 $40 $35 $30 $25 $20 $15 - Goodyear Tire & Rubber $10 EXHIBIT 1: THE GOODYEAR TIRE & RUBBER COMPANY STOCK PRICE JANUARY 2017 TO DECEMBER 2020 $5 01-03-17 3-03-17 05-03-17 07-03-17 -03-17 -S&P 500 index + 100 1-03-17 capitaliq.com (subscription required). 1-03-18 W32285 03-03-18 05-03-18 07-03-18 09- 3-18 11-03-18 01-03-19 Note: The S&P 500 index value has been scaled by dividing by 100 to match the scale of the graph's y-axis. 03-03-19 05-0 Source: Created by the case author based on data from S&P Global Market Intelligence and S&P Capital IQ Platform, 07-03-19 09-03-19 11-03-19 01-03-20 03-0 3-20 05-03-20 7-03-20 09 -20 11-03-20Page 7 W32285 EXHIBIT 2: THE GOODYEAR TIRE & RUBBER COMPANY AND COOPER TIRE & RUBBER COMPANY FIRM CHARACTERISTICS Goodyear Tire & Rubber Cooper Tire & Rubber Date founded 1898 1914 Headquarters Akron, Ohio, USA Findlay, Ohio, USA Brands Goodyear Cooper Dunlop Mastercraft Kelly Avon Debica Starfire Save Roadmaster Fulda Mickey Thompson Manufacturing facilities North, South, and Latin America 23 Europe, Middle East, and Africa (EMEA) 15 Asia Pacific 8 Number of employees 62,000 9,839 Stock price 12/31/2020 $10.91 $40.50 Stock Beta (for 5-year period ending 12/31/2020) 2.17 1.44 Number of shares outstanding 12/31/2020 234.0 million 50.84 million Source: Created by the case author based on The Goodyear Tire & Rubber Company, Form 10-K, December 31, 2020, https://goodyear.gcs-web.com/static-files/db3c7bed-3e01-4632-8f23-263efd65518f; Cooper Tire & Rubber Company, Form 10-K, December 31, 2020, https://www.bamsec.com/filing/2449121000011?cik=24491; and data from S&P Global Market Intelligence and S&P Capital IQ Platform, capitaliq.com (subscription required). EXHIBIT 3: THE GOODYEAR TIRE & RUBBER COMPANY INCOME STATEMENTS 2018-2020 (IN US$ MILLIONS) 2018 2019 2020 Net Sales 15,475 14,745 12,321 Cost of Goods Sold 11,183 10.807 9,478 Selling, Administrative and General Expense 2,312 2,323 2, 192 EBITDA 1,980 1,615 651 Depreciation 778 795 859 EBIT 1.202 820 -208 Interest Expense 321 340 324 Other (Income) Expense 174 98 119 Goodwill and Other Asset Impairments 330 Rationalizations 44 205 159 Income (Loss) before Income Taxes 1,011 177 -1,140 United States and Foreign Tax Expense 303 474 110 Net Income (Loss) 708 -297 -1,250 Note: EBITDA = Earnings before interest, taxes, depreciation, and amortization; EBIT= earnings before interest and taxes; depreciation expense is broken out as a line item assuming it was 100 per cent allocated to cost of goods sold. Source: The Goodyear Tire & Rubber Company, Form 10-K 2020, December 31, 2020, https://goodyear.gcs-web.com/static- files/db3c7bed-3e01-4632-8f23-263efd65518f.Page 8 W32285 EXHIBIT 4: THE GOODYEAR TIRE & RUBBER COMPANY BALANCE SHEETS 2019-2020 (IN US$ MILLIONS) Assets 2019 2020 Current Assets: Cash and Cash Equivalents 908 1,539 Accounts Receivable 1.941 1,691 Inventories 2.851 2,153 Prepaid Expenses and Other Current Assets 234 237 Total Current Assets 5,934 5,620 Property, Plant, and Equipment, net 7 208 7,073 Goodwill 565 408 Intangible Assets 137 135 Deferred Income Taxes 1,527 1.467 Other Assets 959 952 Operating Lease Right-of-Use Assets 851 Total Assets 17,185 16,506 Liabilities Current Liabilities: Accounts Payable Trade 2.908 2.945 Compensation and Benefits Payable 536 540 Other Current Liabilities 734 865 Notes Payable 348 406 Operating Lease Liabilities Due Within One Year 199 198 Long-Term Debt Due Within One Year 562 152 Total Current Liabilities 5,287 5,106 Operating Lease Liabilities 668 684 Long-Term Debt 4.753 5,432 Compensation and Benefits 1,334 1.470 Deferred Income Taxes 90 84 Other Long-Term Liabilities 508 471 Total Liabilities 12,640 13,247 Shareholders' Equity Common Stock 2,374 2,404 Retained Earnings 6.113 4,809 Accumulated Other Comprehensive Loss ( 4,136) ( 4,135) Goodyear Shareholders' Equity 4,351 3.078 Minority Shareholders' Equity Nonredeemable 194 181 Total Shareholders' Equity 4.545 3,259 Total Liabilities and Shareholders' Equity 17,185 16,506 Source: The Goodyear Tire & Rubber Company, Form 10-K 2020, December 31, 2020, https://goodyear.gcs-web.com/static- files/db3c7bed-3e01-4632-8123-263efd65518f.Page 9 W3228 EXHIBIT 5: COOPER TIRE & RUBBER COMPANY INCOME STATEMENTS 2018-2020 (IN US$ THOUSANDS) 2018 2019 | 2020 Net sales 2,808,062 | 2,752,639 | W2,521,074 _ Cost of products sold 2,217,608 2,171,295 | 1874413 Gross profit 590,454 . B46.661 Selling, general and administrative expense 244,221 v F 244 520 EBITDA 346,233 27w 402,132 Depreciation 147,161 148.054 158,847 EBIT 189,072 183273 T 243,285 Net Interest expense 21,965 . 21,731 19,138 Restructuring expense 0 8,818 12,404 Other pension and benefit expense 27,606 | 41,567 25419 Non-operating income (expense) -1,416 k1,485 4,579 Goodwill impairment charge 33,88, 0 0 Income before income taxes 1140588 109.672 190.903 Income tax provision 33495 = 11,355 46,999 Net income 80,563 98,317 143,904 Note: EBITDA = earnings before interest, taxes, depreciation, and amortization; EBIT= earnings before interest and taxes; depreciation expense is broken out as a line item assuming it was 100 per cent allocated to cost of products sold. Source: Created by the case author based on Cooper Tire & Rubber Company, Form 10-K 2020, December 31, 2020, hitps:/ww.bamsec.com/filing/24491210000117cik=24481
Step by Step Solution
There are 3 Steps involved in it

Get step-by-step solutions from verified subject matter experts


