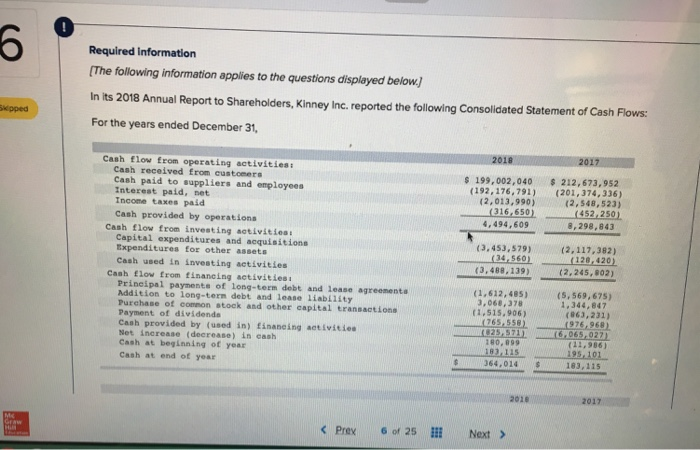
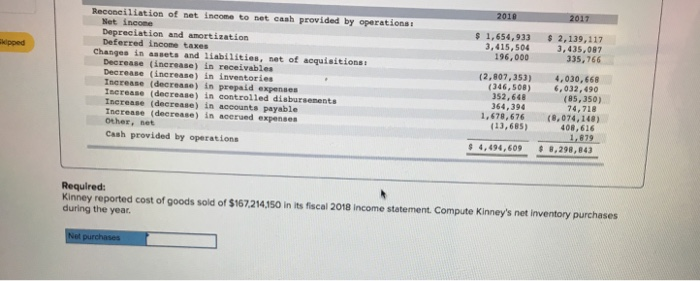
0 6 Required information The following information applies to the questions displayed below. In its 2018 Annual Report to Shareholders, Kinney Inc. reported the following Consolidated Statement of Cash Flows: For the years ended December 31, kpped Cash flow from operating activities: Cash received from customers 199,002,040 212,673,952 Cash paid to suppliers and employees (192,176,791) (201,374,336) Intereat paid, net Income taxes paid (2,013,990) (316,650) 4,494,609 (452 250 Cash provided by operations 8,298,843 (3,453,579)(2,117,382) (2, 245, 802) (1,612,485)5, 569,675) (863,231) Cash flow from investing activities Capital expenditures and acquisitions Expenditures for other assets Cash used in investing activities 4, 560 (120-420 (3,488.139) Cash flow from financing activities Prineipal paymente of long-term debt and lease agreementa Addition to long-term debt and lease liability Purchase of conmon stock and other capital transactions Payment of dividends cash provided by (used in) finaneing activities ,068, 378 (765,558) 80,899 64,014 1,344,847 Net increase (decrease) in cash Cash at beginning of year (11,986) Cash at end of year 183,115 2018 2017 Reconciliation of net income to net caah provided by operations Net incone s 1,654, 933 2,139,117 96,000335,766 (2,807,353) 4,030,668 Depreciation and amortization Deferred incone taxes ,415,504 3,435,087 kipped Changes in assets and liabilities, net of acquisitions: Decrease (increase) in receivables Decrease (increase) in inventories Increase (decrease) in prepaid expenses Iscrease (decrease) in controlled disbursenents Increase (decrease) in accounts payable Increase (decrease) in acerued expenses Other, net Cash provided by operations (346, 508) 6,032,490 352, 648 64,394 (85,350) 74,718 1, 678,676 (8,074,148) 113,685) 408,616 1679 4,494,609 8,298,843 Required: Kinney reported cost of goods sold of $167.214,150 in its fiscal 2018 Income statement Compute Kinney's net inventory purchases during the year