0 Search the web i Manuals a + Week 3A - Forecasting for LawnKing - Excel sekou reid SR X Fil Home Insert Draw Page
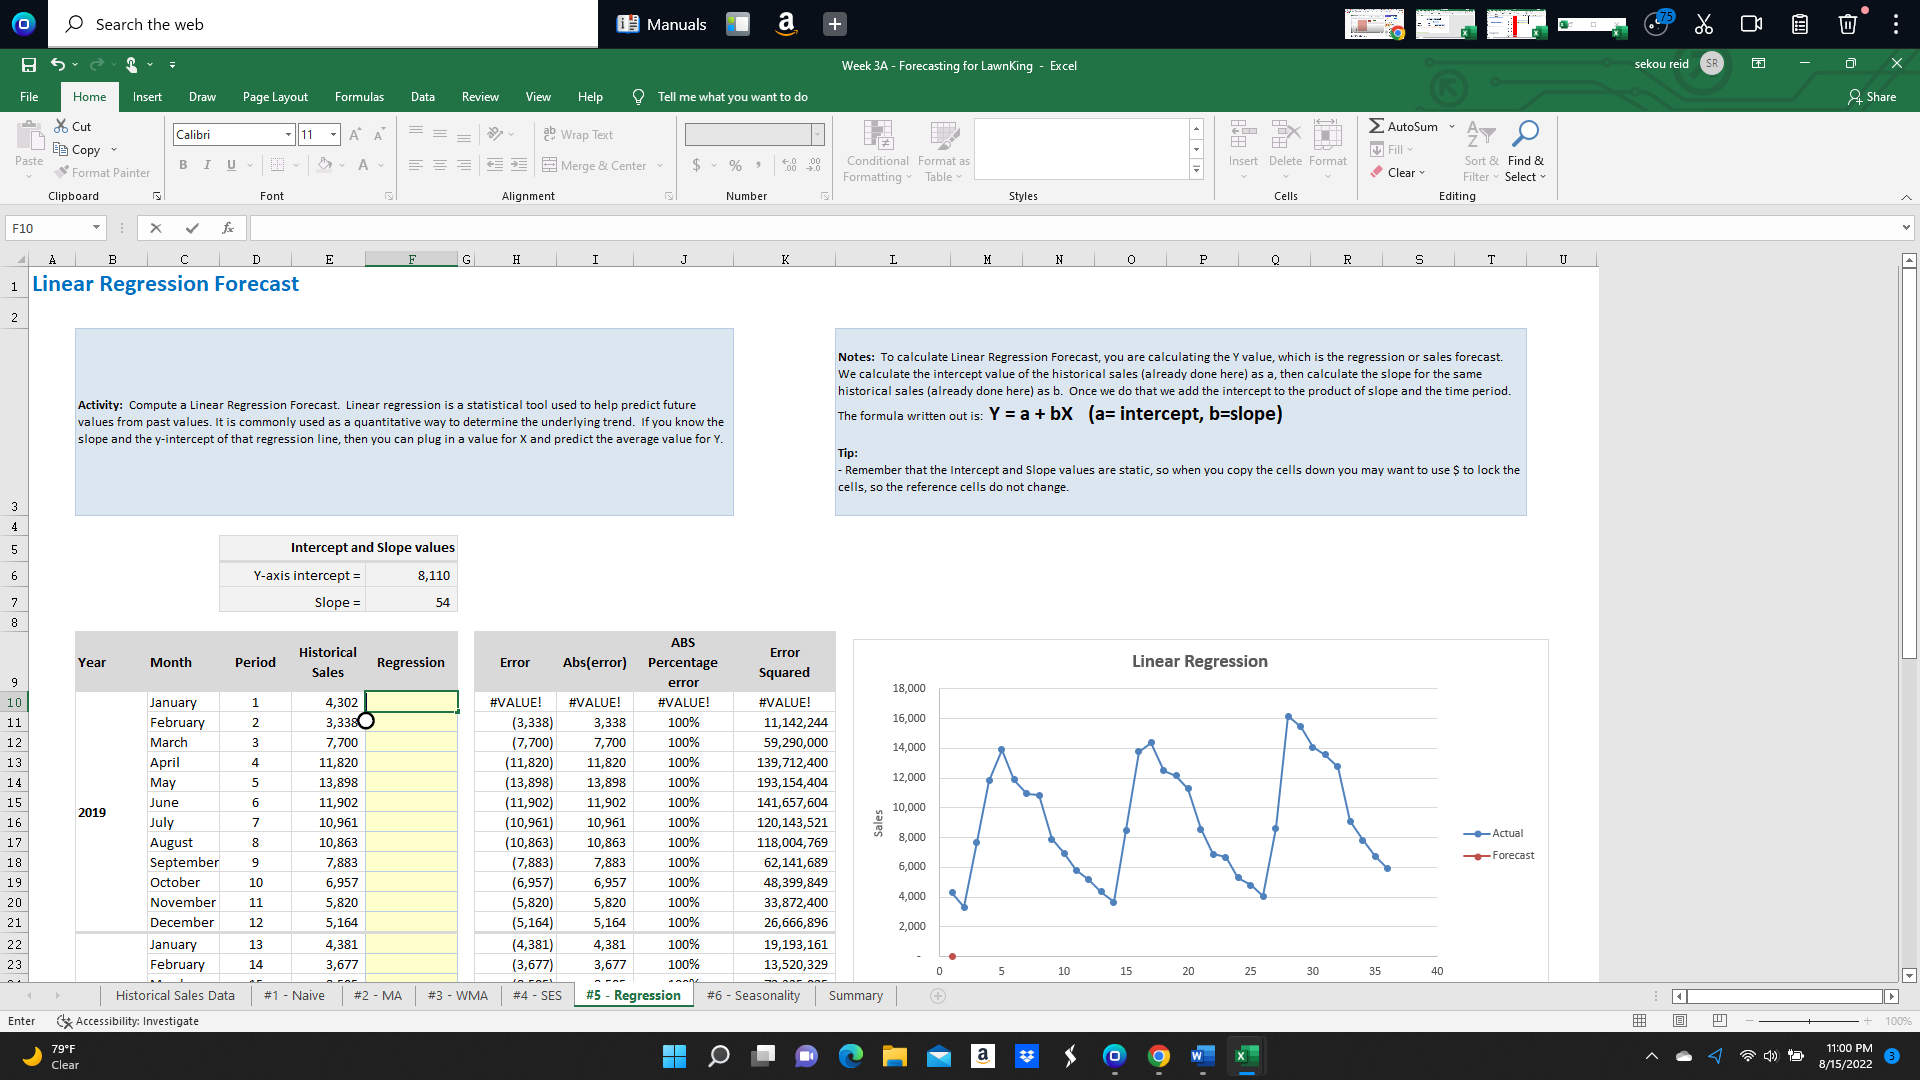
0 Search the web i Manuals a + Week 3A - Forecasting for LawnKing - Excel sekou reid SR X Fil Home Insert Draw Page Layout Formulas Data Review View Help Tell me what you want to do Share to Cut Calibri - 11 - A" A ab Wrap Text AutoSum ~ A O BE Copy Fill Paste IU~ ~ A = =3 Merge & Center $ ~ % " 08 428 Conditional Format as nsert Delete Format Sort & Find & Format Painter Formatting ~ Table ~ v Clear Filter ~ Select ~ Clipboard Font Alignment Number Styles Cells Editing F10 X B D E F G H I J K I M N 0 P Q R S T U Linear Regression Forecast 2 Notes: To calculate Linear Regression Forecast, you are calculating the Y value, which is the regression or sales forecast. We calculate the intercept value of the historical sales (already done here) as a, then calculate the slope for the same historical sales (already done here) as b. Once we do that we add the intercept to the product of slope and the time period. Activity: Compute a Linear Regression Forecast. Linear regression is a statistical tool used to help predict future values from past values. It is commonly used as a quantitative way to determine the underlying trend. If you know the The formula written out is: Y = a + bX (a= intercept, b=slope) slope and the y-intercept of that regression line, then you can plug in a value for X and predict the average value for Y. Tip: - Remember that the Intercept and Slope values are static, so when you copy the cells down you may want to use $ to lock the cells, so the reference cells do not change. Intercept and Slope values Y-axis intercept = 8,110 Slope = 54 ABS Historical Error Year Month Period Regression Error Abs(error) Percentage Linear Regression Sales Squared 9 error 18,000 10 January 4,302 #VALUE! #VALUE! #VALUE! #VALUE! 11 February 3,3380 (3,338) 3,338 100% 11,142,244 16,000 12 March 7,700 (7,700) 7,700 100% 59,290,000 UAWNE 14,000 13 April 11,820 (11,820) 11,820 100% 139,712,400 14 May 13,898 (13,898) 12,000 13,89 100% 193,154,404 15 11,902 (11,902) 11,902 141,657,604 2019 June 100% 10,000 16 July 10,961 (10,961) 10,96 100% 120,143,521 17 10,863 (10,863) 10,863 100% 118,004,769 B,OOO Actual August Forecast 18 September 7,883 (7,883) 7,883 100% $2,141,689 6,000 19 October 10 6,957 (6,957 6,957 100% 18,399,849 20 November 5,820 5,820 5,820 100% 33,872,400 4,000 21 December 12 5,164 5,164 ) 5,164 100% 26,666,896 2,000 22 January 13 4,381 (4,381 4,381 100% 19,193,161 23 February 14 3,677 (3,677) 3,677 100% 13,520,329 5 10 15 20 25 30 35 40 m car Historical Sales Data #1 - Naive #2 - MA #3 - WMA #4 - SES #5 - Regression #6 - Seasonality Summary Enter Accessibility: Investigate 100% 11:00 PM 79 F O a & \\ O 9 w x 4 8/15/2022 3 Clear
Step by Step Solution
There are 3 Steps involved in it
Step: 1
Get Instant Access to Expert-Tailored Solutions
See step-by-step solutions with expert insights and AI powered tools for academic success
Step: 2
Step: 3
Ace Your Homework with AI
Get the answers you need in no time with our AI-driven, step-by-step assistance