

Answered step by step
Verified Expert Solution
Question
1 Approved Answer
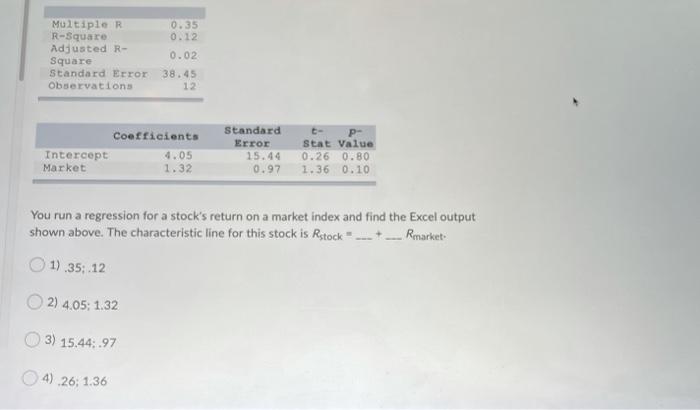
0.35 0.12 Multiple R R-Square Adjusted R- Square Standard Error Observations 0.02 38.45 12 Coefficients Intercept 4.05 Market 1.32 Standard Error 15.44 0.97 P- Stat
Step by Step Solution
There are 3 Steps involved in it
Step: 1

Get Instant Access to Expert-Tailored Solutions
See step-by-step solutions with expert insights and AI powered tools for academic success
Step: 2

Step: 3
Ace Your Homework with AI
Get the answers you need in no time with our AI-driven, step-by-step assistance
Get Started
Fundamentals of Financial Management
Authors: Eugene F. Brigham, Joel F. Houston
Concise 6th Edition
324664559, 978-0324664553