Answered step by step
Verified Expert Solution
Question
1 Approved Answer
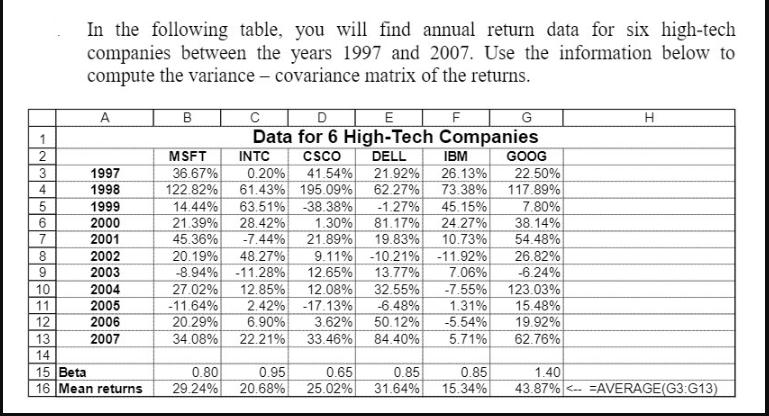
In the following table, you will find annual return data for six high-tech companies between the years 1997 and 2007. Use the information below

In the following table, you will find annual return data for six high-tech companies between the years 1997 and 2007. Use the information below to compute the variance - covariance matrix of the returns. A B C DE F G H 1 Data for 6 High-Tech Companies 2 MSFT 3 1997 4 1998 36.67% 122.82% 5 1999 INTC 0.20% 61.43% 195.09% 14.44% 63.51% -38.38% CSCO 41.54% DELL 21.92% IBM GOOG 26.13% 22.50% 62.27% 73.38% 117.89% -1.27% 45.15% 7.80% 6 2000 21.39% 28.42% 1.30% 81.17% 24.27% 38.14% 7 2001 45.36% -7.44% 21.89% 19.83% 10.73% 54.48% 8 2002 20.19% 48.27% 9.11% -10.21% -11.92% 26.82% 9 2003 -8.94% -11.28% 12.65% 13.77% 7.06% -6.24% 10 2004 27.02% 12.85% 12.08% 32.55% -7.55% 123.03% 11 2005 -11.64% 2.42% -17.13% -6.48% 1.31% 15.48% 12 2006 20.29% 6.90% 3.62% 50.12% -5.54% 19.92% 13 2007 34.08% 22.21% 33.46% 84.40% 5.71% 62.76% 14 15 Beta 0.80 16 Mean returns 29.24% 0.95 20.68% 0.65 0.85 0.85 1.40 25.02% 31.64% 15.34% 43.87%
Step by Step Solution
★★★★★
3.43 Rating (153 Votes )
There are 3 Steps involved in it
Step: 1
Anwers To calculate the variancecovariance matrix of the returns we first need to calculate the returns for each company over the 11year period The returns are calculated as the difference between the ...
Get Instant Access to Expert-Tailored Solutions
See step-by-step solutions with expert insights and AI powered tools for academic success
Step: 2

Step: 3

Ace Your Homework with AI
Get the answers you need in no time with our AI-driven, step-by-step assistance
Get Started


