Answered step by step
Verified Expert Solution
Link Copied!

Question

1 Approved Answer

1) A random sample of fruit juices in the store shows the following calories per serving: 150, 110, 100, 35, 60, 130, 40, 140, 120,
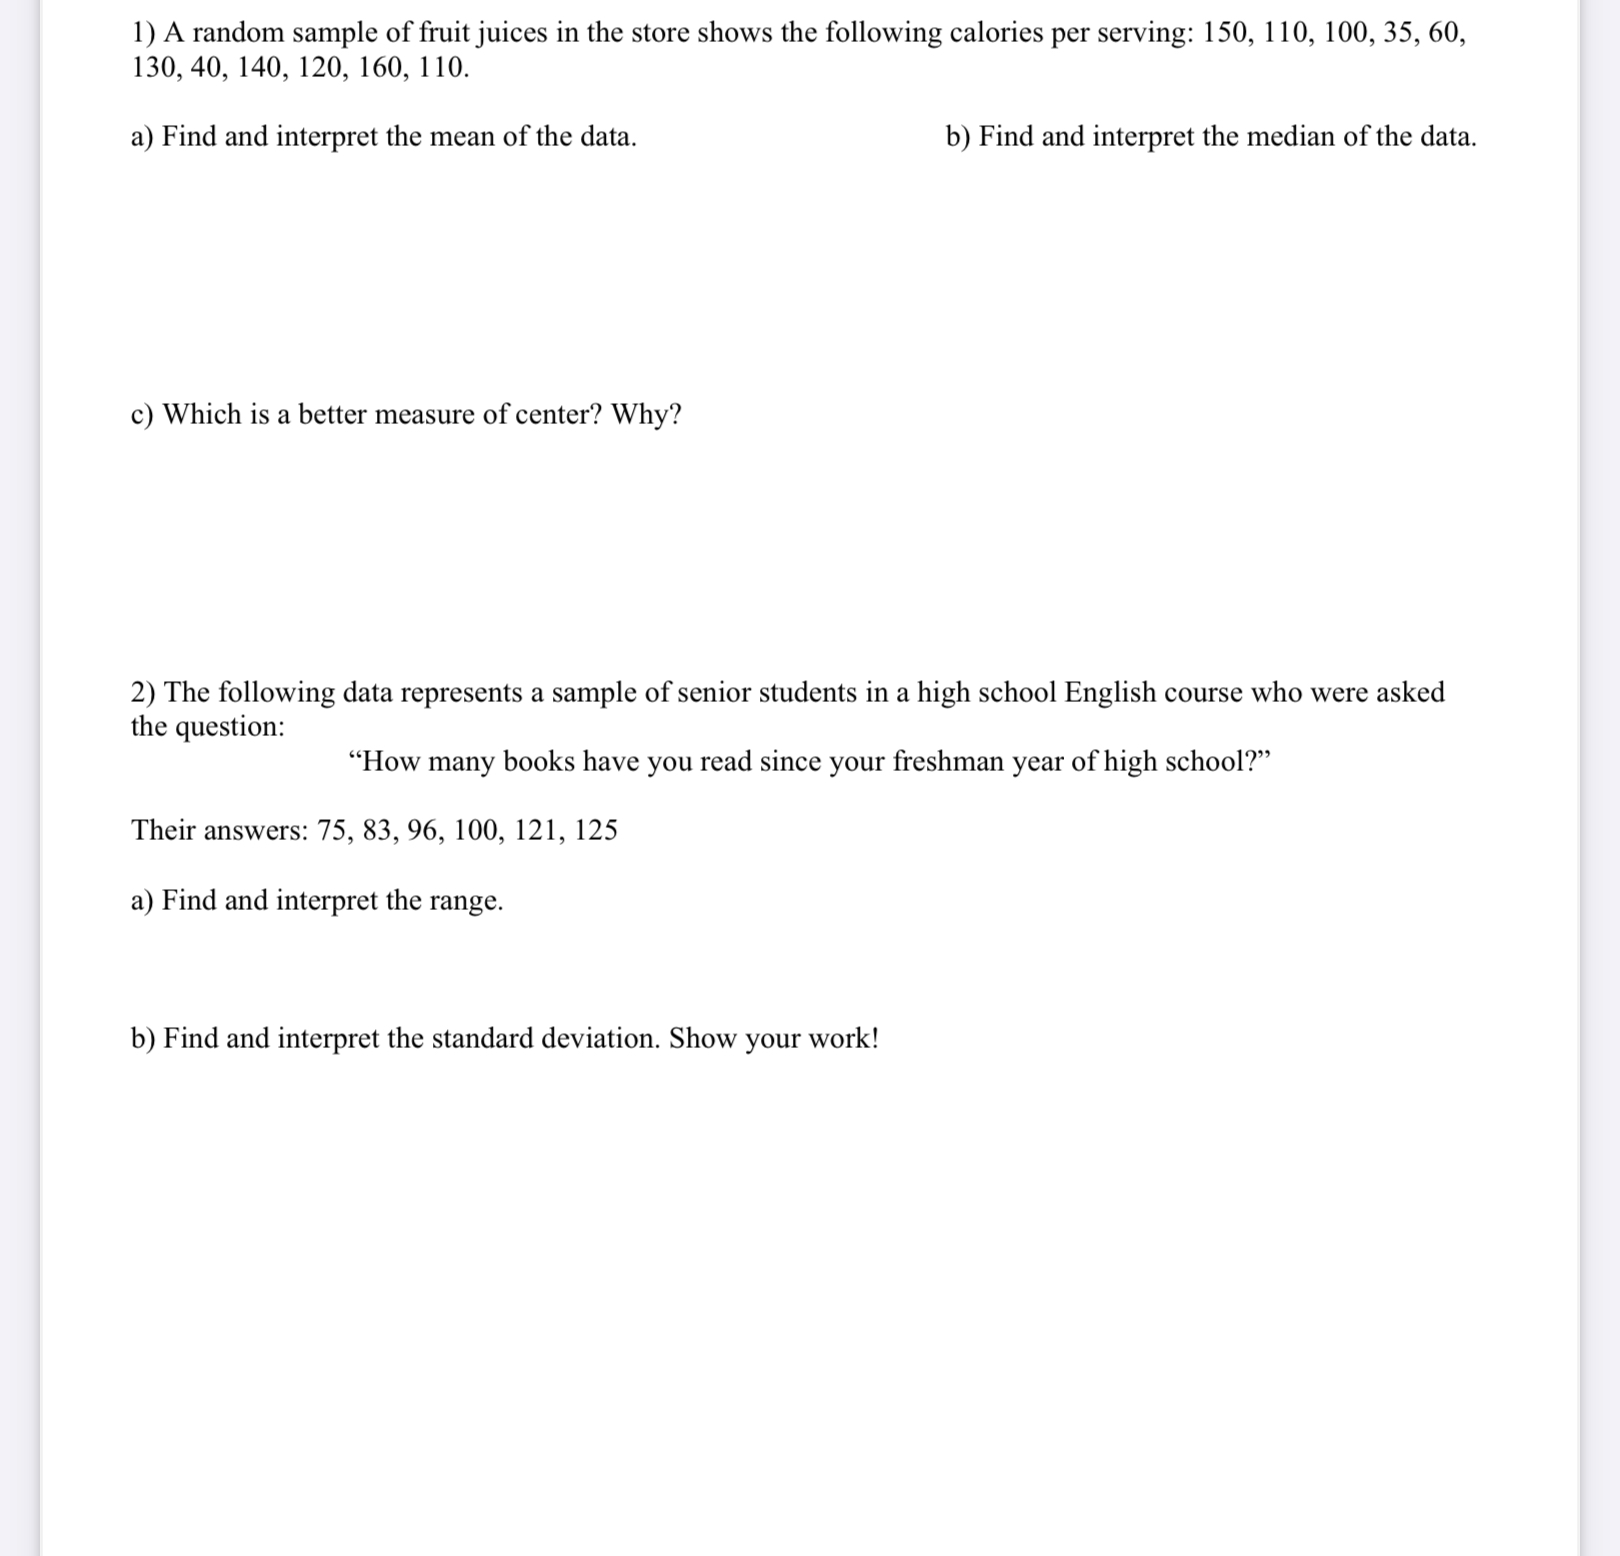
image text in transcribed
1) A random sample of fruit juices in the store shows the following calories per serving: 150, 110, 100, 35, 60, 130, 40, 140, 120, 160, 110. a) Find and interpret the mean of the data. b) Find and interpret the median of the data. ) Which is a better measure of center? Why? 2) The following data represents a sample of senior students in a high school English course who were asked the question: \"How many books have you read since your freshman year of high school?\" Their answers: 75, 83, 96, 100, 121, 125 a) Find and interpret the range. b) Find and interpret the standard deviation. Show your work

Step by Step Solution

There are 3 Steps involved in it

Step: 1

blur-text-image

Get Instant Access to Expert-Tailored Solutions

See step-by-step solutions with expert insights and AI powered tools for academic success

Step: 2

blur-text-image

Step: 3

blur-text-image

Ace Your Homework with AI

Get the answers you need in no time with our AI-driven, step-by-step assistance

Get Started

Recommended Textbook for

Advanced Engineering Mathematics

Authors: Erwin Kreyszig

10th edition

470458364, 470458365, 978-0470458365

More Books

Students also viewed these Mathematics questions