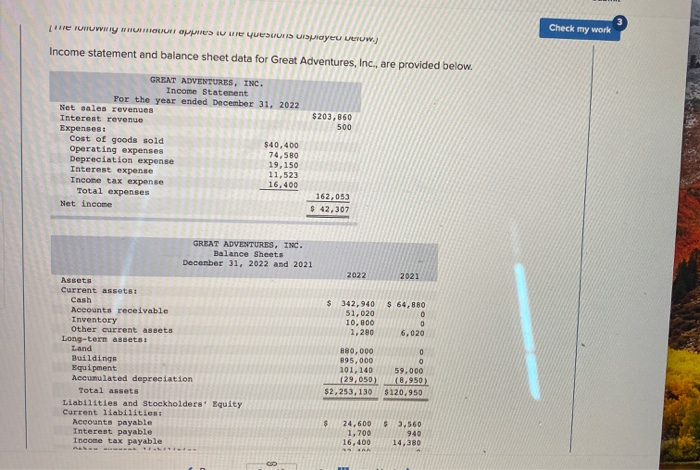
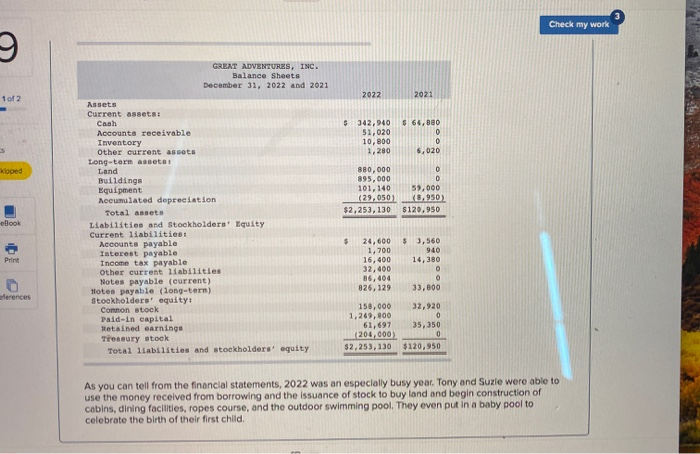
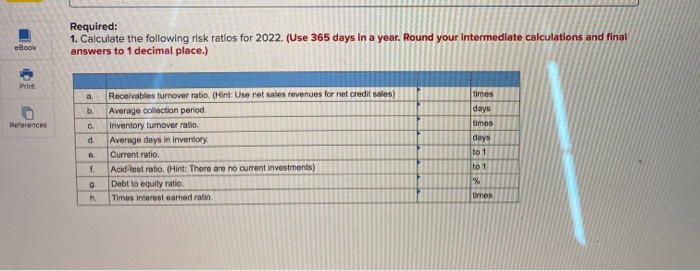
1 ayev U Check my work Income statement and balance sheet data for Great Adventures, Inc., are provided below. $203,860 500 GREAT ADVENTURES, INC. Income Statement For the year ended December 31, 2022 Net sales revenues Interest revenue Expenses: Cost of goods sold $40,400 Operating expenses 74,580 Depreciation expense 19,150 Interest expense 11,523 Income tax expense 16,400 Total expenses Net income 162,053 $ 42,307 GREAT ADVENTURES, INC. Balance Sheets December 31, 2022 and 2021 2022 2021 $ 342,940 51,020 10,000 1,280 $ 64,880 0 0 6,020 0 Assets Current assets Cash Accounts receivable Inventory Other current assets Long-term assets Land Buildings Equipment Accumulated depreciation Total assets Liabilities and Stockholders' Equity Carrent liabilities: Accounts payable Interest payable Income tax payable 880,000 895,000 101,140 (29,050) $2,253,130 59,000 (8.950) $120.950 $ 24.600 1,700 16,400 HAN 3,560 940 14,380 Check my work 3 GREAT ADVENTURES, INC. Balance Sheets December 31, 2022 and 2021 1 of 2 2022 2021 $ 342,940 51,020 10,800 1,280 $ 64,880 D 0 6,020 5 kloped 880,000 895,000 101, 140 (22.0501 $2,253,130 0 0 59,000 (3.950) $120.950 Book Assets Current assets: Cash Accounts receivable Inventory Other current assets Long-term asseter Land Buildings Equipment Mecumulated depreciation Total assets Liabilities and Stockholders' Equity Current liabilities: Accounts payable Interest payable Income tax payable other current liabilities Notes payable (current) Notes payable (long-tern) Stockholders' equity: Common stock Paid-in capital Retained earnings Treasury stock Total liabilities and stockholders' equity $ 5 24,600 1,700 16,400 32,400 86,404 826,129 3,560 940 14,380 0 Print 33,800 erences 158,000 1,249,800 61,697 (204,000) $2,253,130 32,920 0 35, 350 0 $120,950 As you can tell from the financial statements, 2022 was an especially busy year. Tony and Suzie were able to use the money received from borrowing and the issuance of stock to buy land and begin construction of cabins, dining facilities, ropes course, and the outdoor swimming pool. They even put in a baby pool to celebrate the birth of their first child Required: 1. Calculate the following risk ratios for 2022. (Use 365 days in a year. Round your intermediate calculations and final answers to 1 decimal place.) eBook Print b mobile times days times days References C d Receivables turnover ratio. (Hint: Use net sales revenues for not credit sales) Average collection period Inventory turnover ratio Average days in inventory Current ratio Acid-test ratio. (Hint: There are no current investments) Debt to equity ratio Times interest earned ratio e to 1 f to 1 % h times


