Answered step by step
Verified Expert Solution
Question
1 Approved Answer
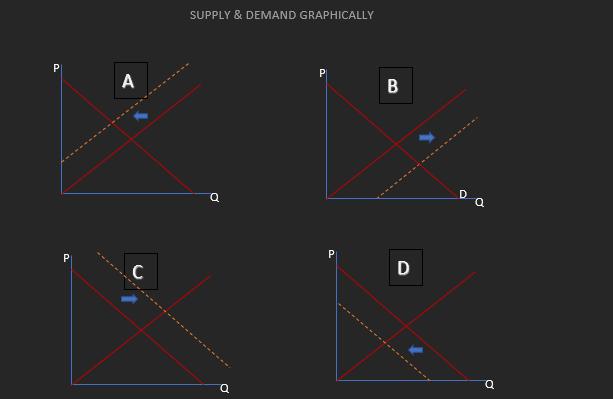
1. Based on the above illustrations and what you learned about supply and demand in , which graph (A, B, C, or D) represents


1. Based on the above illustrations and what you learned about supply and demand in , which graph (A, B, C, or D) represents a decrease in supply? (10 points) 2. Based on the above illustrations and what you learned about supply and demand in which graph (A, B, C, or D) represents a decrease in demand? (10 points) 3. Let's say the price of Lexus has increased significantly, which graph (A, B, C, or D) represents what would happen in the market for Mercedes Benz? (20 points) 4. Let's say the price of computer chips has increased significantly, which graph (A, B, C, or D) represents what would happen in the market for computers? (20 points) 5. If we discover that red wine causes cancer, which graph (A, B, C, or D) represents what would happen in the red wine market? (20 points) 6. Let's say the price of steel doubles, which graph (A, B, C, or D) represents what would happen in the market for automobiles? (20 points) P P A C SUPPLY & DEMAND GRAPHICALLY ******** Q a P P B D a 0
Step by Step Solution
There are 3 Steps involved in it
Step: 1
ANSWER Answer 1 Graph D represents a decrease in demand Demand curve is depicted by the downward slo...
Get Instant Access to Expert-Tailored Solutions
See step-by-step solutions with expert insights and AI powered tools for academic success
Step: 2

Step: 3

Ace Your Homework with AI
Get the answers you need in no time with our AI-driven, step-by-step assistance
Get Started


