1) Based on the data in the financial statements which company/companies may be employing a Differentiation Strategy?
2) What data can you see in the financial statements that support your answer to #1? Provide at least two data points with your insights to support your answer to #1.
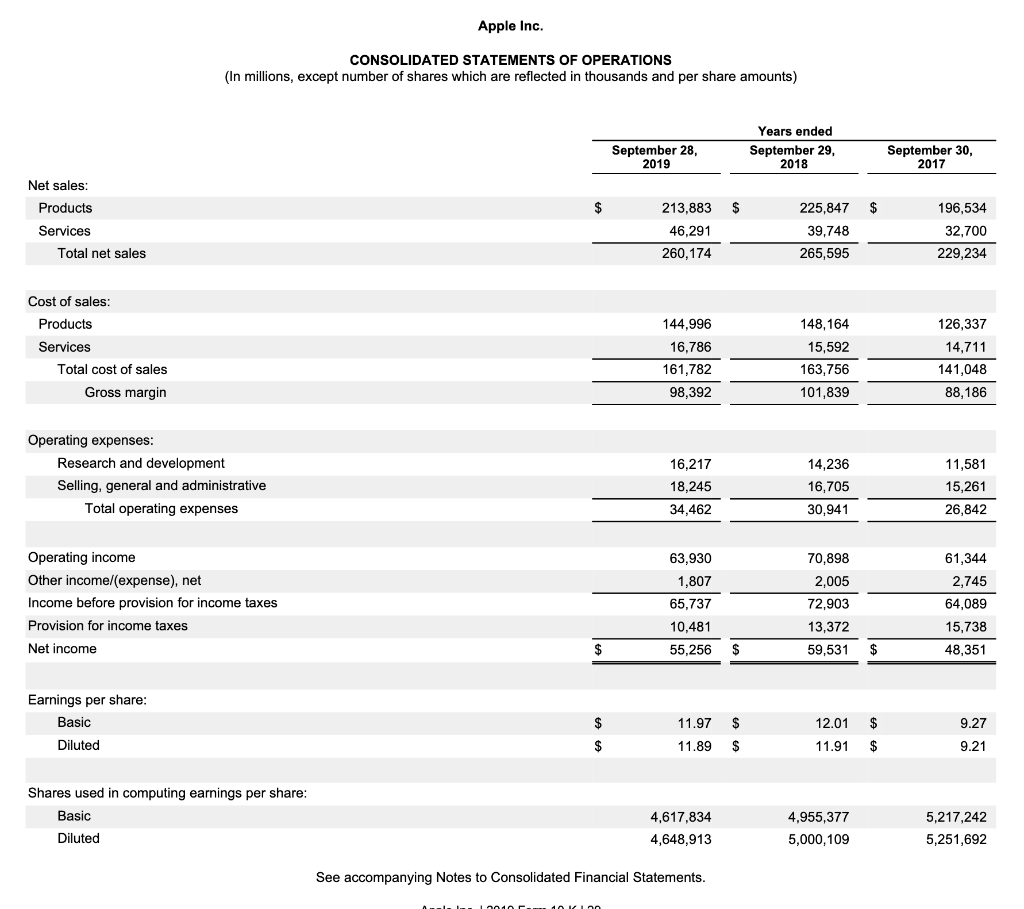
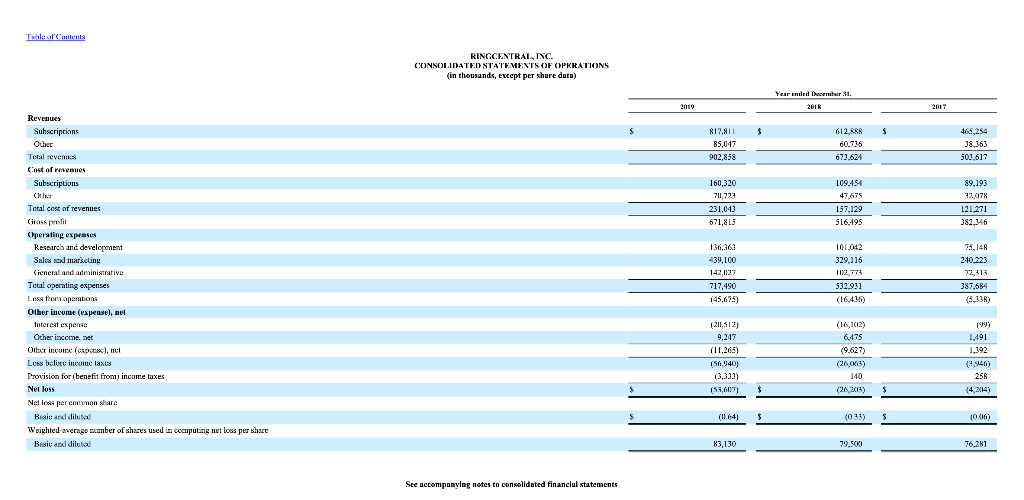
Apple Inc. CONSOLIDATED STATEMENTS OF OPERATIONS (In millions, except number of shares which are reflected in thousands and per share amounts) September 28, 2019 Years ended September 29, 2018 September 30, 2017 Net sales: Products $ $ $ Services Total net sales 213,883 46,291 260,174 225,847 39,748 265,595 196,534 32,700 229,234 Cost of sales: Products Services Total cost of sales Gross margin 144,996 16,786 161,782 98,392 148,164 15,592 163,756 101,839 126,337 14,711 141,048 88,186 Operating expenses: Research and development Selling, general and administrative Total operating expenses 16,217 18,245 34,462 14,236 16,705 11,581 15,261 26,842 30,941 63,930 61,344 1,807 2,745 Operating income Other income/expense), net Income before provision for income taxes Provision for income taxes Net income 70,898 2,005 72,903 13,372 65,737 10,481 55,256 64,089 15,738 48,351 $ $ 59,531 $ Earnings per share: Basic Diluted $ 11.97 $ 12.01 $ 9.27 9.21 $ 11.89 $ 11.91 Shares used in computing earnings per share: Basic Diluted 4,617,834 4,648,913 4,955,377 5,000,109 5,217.242 5,251,692 See accompanying Notes to Consolidated Financial Statements. Table of Contents RINGCENTRAL, INC. CONSOLIDATED STATEMENTS OF OPERATIONS (in thousands, except per share data) Year ended Tecember 31 2019 2016 2017 $ $ 466,254 Revenues Subscriptions Other Total revenues Cost of revenues Subscriptions 817.811 85.047 902,858 612.RRR 60.735 501.617 160,320 109.454 47,675 157.129 516495 89,193 32,078 121.271 381.446 231,00 671,815 136,369 439,100 142,1127 717,490 145,675) 101.042 329.116 102,773 532.931 (16,436) 75,148 240223 72,313 387,684 5,138) Total cost of revenues Grass profit Operating expuses Research and development Sales od marching Cieneral and administrative Total operating expenses Less from apamtion Other income (expe), nel Interest expense Other income.net Other income (ap), nel Loss bclic income taxes Provision for benefit from) income taxes Net loss Netlos per common stare Basic and diluta Weighted average number of shares used in computing net loss per share - Basic and diluted (112) 6,475 (9.627) 1993 1,491 1,392 (211,512) 9,247 (11,265) (50,940) (3.332) (53,607) 140 256 (4,214) $ $ (033) ( 10:06) ) 83,130 79.500 76.281 See accompanying notes to consolidated financial statements