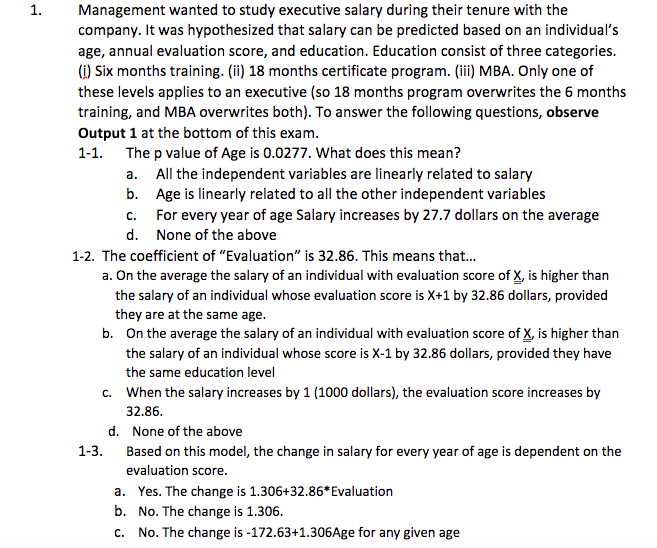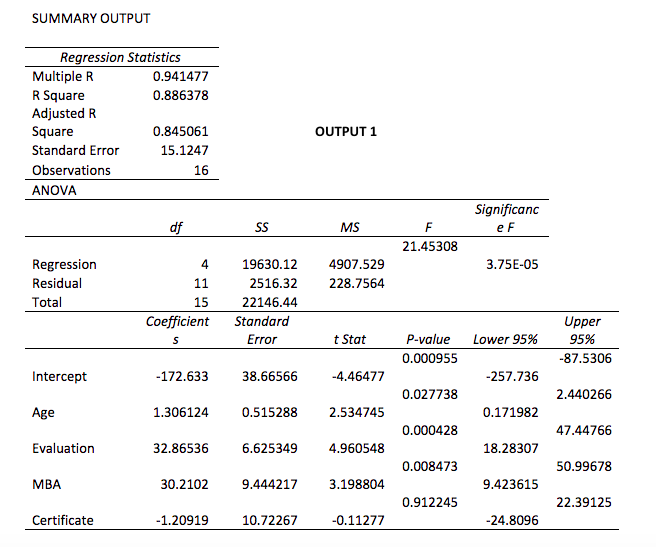

1. C. Management wanted to study executive salary during their tenure with the company. It was hypothesized that salary can be predicted based on an individual's age, annual evaluation score, and education. Education consist of three categories. (1) Six months training. (ii) 18 months certificate program. (iii) MBA. Only one of these levels applies to an executive (so 18 months program overwrites the 6 months training, and MBA Overwrites both). To answer the following questions, observe Output 1 at the bottom of this exam. 1-1. The p value of Age is 0.0277. What does this mean? a. All the independent variables are linearly related to salary b. Age is linearly related to all the other independent variables For every year of age Salary increases by 27.7 dollars on the average d. None of the above 1-2. The coefficient of Evaluation is 32.86. This means that... a. On the average the salary of an individual with evaluation score of X, is higher than the salary of an individual whose evaluation score is X+1 by 32.86 dollars, provided they are at the same age. b. On the average the salary of an individual with evaluation score of X, is higher than the salary of an individual whose score is X-1 by 32.86 dollars, provided they have the same education level c. When the salary increases by 1 (1000 dollars), the evaluation score increases by 32.86. d. None of the above 1-3. Based on this model, the change in salary for every year of age is dependent on the evaluation score. a. Yes. The change is 1.306+32.86*Evaluation b. No. The change is 1.306. C. No. The change is -172.63+1.306Age for any given age SUMMARY OUTPUT Regression Statistics Multiple R 0.941477 R Square 0.886378 Adjusted R Square 0.845061 Standard Error 15.1247 Observations 16 ANOVA OUTPUT 1 Significanc ef df SS MS F 21.45308 3.75E-05 Regression Residual Total 4907.529 228.7564 4 11 15 Coefficient 19630.12 2516.32 22146.44 Standard Error S t Stat Lower 95% P-value 0.000955 Upper 95% -87.5306 Intercept -172.633 38.66566 -4.46477 -257.736 0.027738 2.440266 Age 1.306124 0.515288 2.534745 0.171982 0.000428 47.44766 Evaluation 32.86536 6.625349 4.960548 18.28307 0.008473 50.99678 MBA 30.2102 9.444217 3.198804 9.423615 0.912245 22.39125 Certificate -1.20919 10.72267 -0.11277 -24.8096 1. C. Management wanted to study executive salary during their tenure with the company. It was hypothesized that salary can be predicted based on an individual's age, annual evaluation score, and education. Education consist of three categories. (1) Six months training. (ii) 18 months certificate program. (iii) MBA. Only one of these levels applies to an executive (so 18 months program overwrites the 6 months training, and MBA Overwrites both). To answer the following questions, observe Output 1 at the bottom of this exam. 1-1. The p value of Age is 0.0277. What does this mean? a. All the independent variables are linearly related to salary b. Age is linearly related to all the other independent variables For every year of age Salary increases by 27.7 dollars on the average d. None of the above 1-2. The coefficient of Evaluation is 32.86. This means that... a. On the average the salary of an individual with evaluation score of X, is higher than the salary of an individual whose evaluation score is X+1 by 32.86 dollars, provided they are at the same age. b. On the average the salary of an individual with evaluation score of X, is higher than the salary of an individual whose score is X-1 by 32.86 dollars, provided they have the same education level c. When the salary increases by 1 (1000 dollars), the evaluation score increases by 32.86. d. None of the above 1-3. Based on this model, the change in salary for every year of age is dependent on the evaluation score. a. Yes. The change is 1.306+32.86*Evaluation b. No. The change is 1.306. C. No. The change is -172.63+1.306Age for any given age SUMMARY OUTPUT Regression Statistics Multiple R 0.941477 R Square 0.886378 Adjusted R Square 0.845061 Standard Error 15.1247 Observations 16 ANOVA OUTPUT 1 Significanc ef df SS MS F 21.45308 3.75E-05 Regression Residual Total 4907.529 228.7564 4 11 15 Coefficient 19630.12 2516.32 22146.44 Standard Error S t Stat Lower 95% P-value 0.000955 Upper 95% -87.5306 Intercept -172.633 38.66566 -4.46477 -257.736 0.027738 2.440266 Age 1.306124 0.515288 2.534745 0.171982 0.000428 47.44766 Evaluation 32.86536 6.625349 4.960548 18.28307 0.008473 50.99678 MBA 30.2102 9.444217 3.198804 9.423615 0.912245 22.39125 Certificate -1.20919 10.72267 -0.11277 -24.8096


