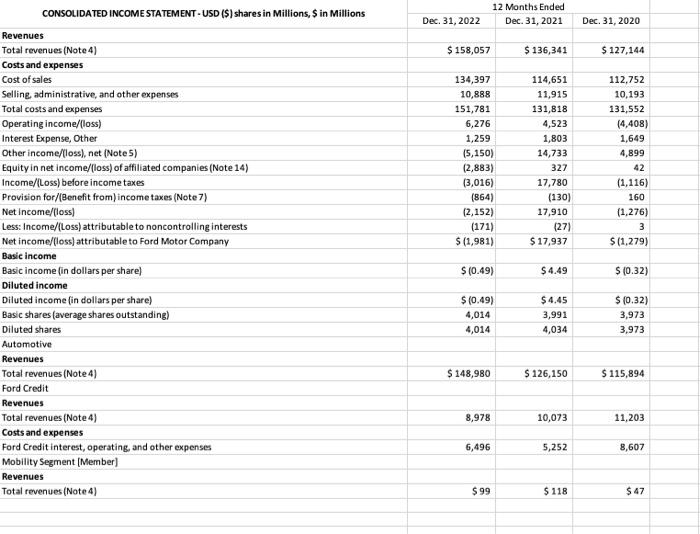
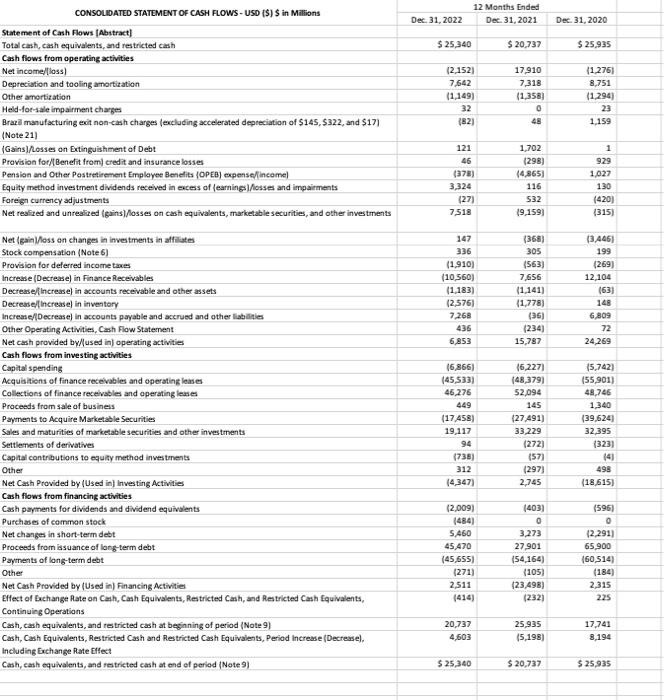
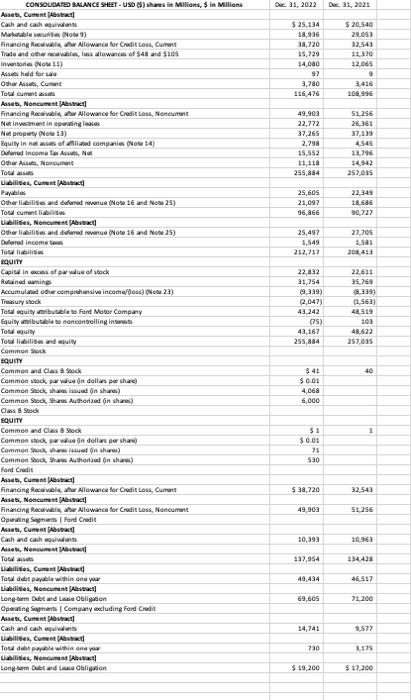
1. Calculate and interpret those ratios for two years:
1. Current ratio
2. Quick ratio
3. Average daily sales (Net sales/365 days)
4. Day's sales outstanding (Average net receivables / Average daily sales)
5. Gross peofit percentage
6. Inventory turnover ratio
7. Debt ratio
8. Times interest earned ratio
2. Perform a Trend Analysis for the most recent two years.
3. Prepare a Common Sized Balance Sheet statement for the most recent year.
CONSOLIDATED INCOME STATEMENT - USD (\$) shares in Millions, \$ in Millions Revenues Total revenues (Note 4) 12 Months Ended Costs and expenses Cost of sales Selline administrative, and other expenses Total costs and expenses Operating income/(loss) Interest Expense, Other Other income/(loss), net (Notes) Equity in net income/(loss) of affiliated companies (Note 14) Income/(Loss) before income taxes Provision for/(Benefit from) income taxes (Note 7) Net income/[loss) Less: Income/(Loss) attributable to noncontrolling interests Net income/(loss) attributable to Ford Motor Company Basic income Basic income (in dollars per share) Diluted income Diluted income (in dollars per share) Basic shares (average shares outstanding) Diluted shares Automotive Revenues Total revenues (Note 4) Ford Credit Revenues Total revenues (Note 4) Costs and expenses Ford Credit interest, operating, and other expenses Mobility Segment [Member] Revenues Total revenues (Note 4) Dec. 31,2022 Dec. 31, 2021 $158,057 134,397 10,888 151,781 6,276 1,259 (5,150) (2,883) (3,016) (864) (2,152) (171) $(1,981) $(0.49) $(0.49) 4,014 4,014 $148,980 8,978 6,496 $99 $136,341 114,651 11,915 131,818 4,523 1,803 14,733 327 17,780 (130) 17,910 (27) $17,937 $4.49 $4,45 3,991 4,034 Dec. 31, 2020 $127,144 112,752 10,193 131,552 (4,408) 1,649 4,899 42 (1,116) 160 (1,276) 3 $(1,279) $(0.32) $(0.32) 3,973 3,973 CONSOUDATED STATEMENT OF CASH FLOWS - USD ( $ ) $ in Millions Statement of Cash Flows [Abtract] Total cash, cash equivalents, and restricted cash Cash flows from operating activities Net incomellioss] Depreciation and tooling amortitation Other amertication Held-for-sale impairment charges Brazil manufacturing exit non-cash charges (excluding accelerated depteciation of $145,$322, and $17 ) [Note 21) [Gains]/Rosses on Extinguishment of Debt Provision forf(Benefit from) credit and insurance losses Pension and Other Pestretirement Emplayee Benclits (OPEB) expenseflincome) Equity method investment dividends received in excess of (earning)/fosses and impairments Foreign currency adjustments Net realized and unrealized (gains)/Nosses on cash equivalents, marketable securities, and other inves tments Net (gain)/hoss on changes in investments in affilates Stock compensation (Note 6) Provision for deferred income taves Increase (Decrease) in Finance Receivables Decreasef increase) in accounts receivable and other assets Decreasef(increase) in inventory increase/pecrease) in accounts payable and accrued and other liabilites Other Operating Activities, Cash Flow Statement Net cash provided by//used in) operating activities Cash flows from investing activities Capital spending Acquiltions of finance recevables and operating leases Collections of finance receivables and operating lexses Proceads from sale of busineis Payments to Acquire Marketable Securities Sales and maturities of marketable securities and other investments Settleneats of derivatives Capital contributions to equify method inves tenents Other Net Cash Provided by (Used in) Investing Activities Cash flows from financing activities Cash payments for dividends and dividend equivolents Purchases of common stock Net changes in shart-term debt Proceeds from issuance of long-term debt Payments of long-term debt Other Net Cash Provided by (Used in) Financing Activities Effect of Euchange Rate on Cah, Cash Equivalents, Restricted Cash, and Restricted Cash Cquivalents, Continuing Operations Cash, cash equivalents, and restricted cash at beginning of period (Note 9) Cash, Cash Equivalents, Restricted Cash and Restricted Cash Equivalents, Period increase (Decrease), Including Crchange Rate Effect Cash, cash equivalents, and restricted cash at end of period (Note 9) 12 Months Ended Dec. 31, 2022 Dec. 31, 2021 Dec. 31, 2020 $25,340 $20,737 $25.935 (2,152) 7,642 (1,149) 32 (82) 17,910 (1,276\} 7,318 8,751 (1,358) (1,294) 23 48 1,159 121 46 (378) 3,324 (27) 7,518 147 336 (1,910) (10,560) (1,183) (2,576) 7.268 435 6,853 (6,866) (45,533) 46,276 449 (17,458) 1,702 (298) (4,865) 116 532 (9,159) (368) 305 (563) 7,656 (1,141) \{1,778\} (35) (234) 15,787 (6,227) (48,379) 52,094 145 (27,491) 33,229 (272) (57) (297) 2,745 (403) 0 3.273 27,901 (54,164) (105) (23,498) (232) 2.511 (414) 20,737 4.603 25,935 (5,198) 525,340 $20,737 $20.737 525,935 17,741 8,194 [2,291] 65,900 (60,514) (184) 2,315 225 (4) 498 (18,615) (596)