

Question
1. Calculate the standard deviations and coefficients of variation of returns for the four alternatives. How do the alternatives compare when risk is considered? a.
1. Calculate the standard deviations and coefficients of variation of returns for the four alternatives. How do the alternatives compare when risk is considered? a. What type of risks do these statistics measure? b. Is the standard deviation or the coefficient of variation the better measure?
2. Suppose an investor forms a stock portfolio by investing $10,000 in Freeport-McMoran and $10,000 in Entergy Corp. a. What would be the portfolios expected rate of return, standard deviation, and coefficient of variation? How does this compare with values for the individual stocks? What characteristic of the two investments makes risk reduction possible? b. What do you think would happen to the portfolios expected rate of return and standard deviation if the portfolio contained 75 percent Freeport-McMoran? If it contained 75 percent Entergy Corp.? Using excel, construct the portfolio to substantiate your answers. (Add table)
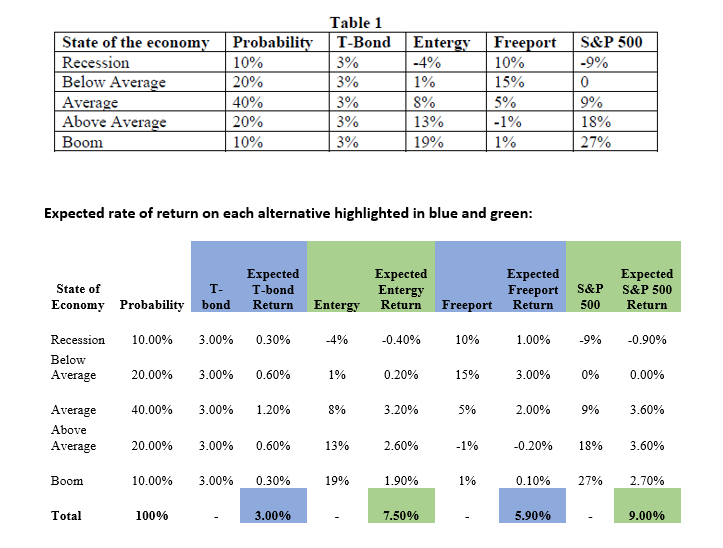
State of the economy Recession Below Average Average Above Average Boom Probability 10% 20% 40% 20% 10% Table 1 T-Bond 3% 3% 3% 3% 3% Entergy Freeport -4% 10% 1% 15% 8% 5% 13% -1% 19% 1% S&P 500 -9% 0 9% 18% 27% Expected rate of return on each alternative highlighted in blue and green: State of T- Economy Probability bond Expected T-bond Return Entergy Expected Entergy Return Expected Freeport S&P Return 500 Expected S&P 500 Return Freeport 10.00% 3.00% 0.30% -4% -0.40% 10% 1.00% -9% -0.90% Recession Below Average 20.00% 3.00% 0.60% 1% 0.20% 15% 3.00% 0% 0.00% 40.00% 3.00% 1.20% 8% 3.20% 5% 2.00% 9% 3.60% Average Above Average 20.00% 3.00% 0.60% 13% 2.60% -1% -0.20% 18% 3.60% Boom 10.00% 3.00% 0.30% 19% 1.90% 1% 0.10% 27% 2.70% Total 100% 3.00% 7.50% 5.90% 9.00% State of the economy Recession Below Average Average Above Average Boom Probability 10% 20% 40% 20% 10% Table 1 T-Bond 3% 3% 3% 3% 3% Entergy Freeport -4% 10% 1% 15% 8% 5% 13% -1% 19% 1% S&P 500 -9% 0 9% 18% 27% Expected rate of return on each alternative highlighted in blue and green: State of T- Economy Probability bond Expected T-bond Return Entergy Expected Entergy Return Expected Freeport S&P Return 500 Expected S&P 500 Return Freeport 10.00% 3.00% 0.30% -4% -0.40% 10% 1.00% -9% -0.90% Recession Below Average 20.00% 3.00% 0.60% 1% 0.20% 15% 3.00% 0% 0.00% 40.00% 3.00% 1.20% 8% 3.20% 5% 2.00% 9% 3.60% Average Above Average 20.00% 3.00% 0.60% 13% 2.60% -1% -0.20% 18% 3.60% Boom 10.00% 3.00% 0.30% 19% 1.90% 1% 0.10% 27% 2.70% Total 100% 3.00% 7.50% 5.90% 9.00%Step by Step Solution
There are 3 Steps involved in it
Step: 1

Get Instant Access to Expert-Tailored Solutions
See step-by-step solutions with expert insights and AI powered tools for academic success
Step: 2

Step: 3
Ace Your Homework with AI
Get the answers you need in no time with our AI-driven, step-by-step assistance
Get Started
Crypto Asset Investing In The Age Of Autonomy
Authors: Jake Ryan
1st Edition
1119705363, 978-1119705369