Answered step by step
Verified Expert Solution
Question
1 Approved Answer
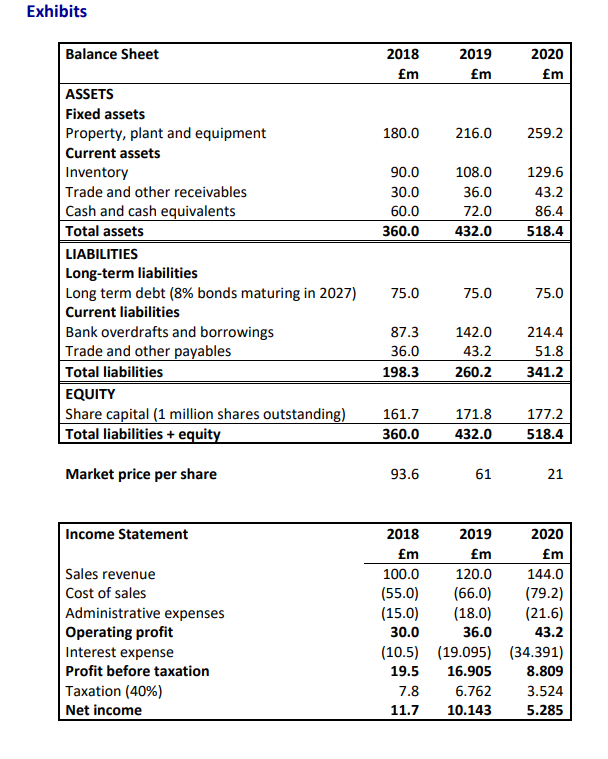
1. Calculate Tour de Force (TdF) plc's annual growth rate for sales, assets, and operating profit in 2019 and 2020. Explain fully what are


1. Calculate Tour de Force (TdF) plc's annual growth rate for sales, assets, and operating profit in 2019 and 2020. Explain fully what are the underlying drivers of these growth rates? Exhibits Balance Sheet ASSETS Fixed assets Property, plant and equipment Current assets Inventory Trade and other receivables Cash and cash equivalents Total assets LIABILITIES Long-term liabilities Long term debt (8% bonds maturing in 2027) Current liabilities Bank overdrafts and borrowings Trade and other payables Total liabilities EQUITY Share capital (1 million shares outstanding) Total liabilities + equity Market price per share Income Statement Sales revenue Cost of sales Administrative expenses Operating profit Interest expense Profit before taxation Taxation (40%) Net income 2018 m 180.0 90.0 30.0 60.0 360.0 75.0 87.3 36.0 198.3 161.7 360.0 93.6 2019 m 7.8 11.7 216.0 108.0 36.0 72.0 432.0 75.0 142.0 43.2 260.2 171.8 432.0 61 2018 m 100.0 (55.0) (15.0) 30.0 (10.5) (19.095) 19.5 16.905 6.762 10.143 2019 m 120.0 (66.0) (18.0) 36.0 2020 m 259.2 129.6 43.2 86.4 518.4 75.0 214.4 51.8 341.2 177.2 518.4 21 2020 m 144.0 (79.2) (21.6) 43.2 (34.391) 8.809 3.524 5.285
Step by Step Solution
★★★★★
3.41 Rating (151 Votes )
There are 3 Steps involved in it
Step: 1
To calculate Tour de Force TdF plcs annual growth rate for sales assets and operating profit in 2019 ...
Get Instant Access to Expert-Tailored Solutions
See step-by-step solutions with expert insights and AI powered tools for academic success
Step: 2

Step: 3

Ace Your Homework with AI
Get the answers you need in no time with our AI-driven, step-by-step assistance
Get Started


