

Question: (1) CAPM predicts that a security's risk premium increase in proportion to its beta of the security, not its volatility. Justify this statement using Figures
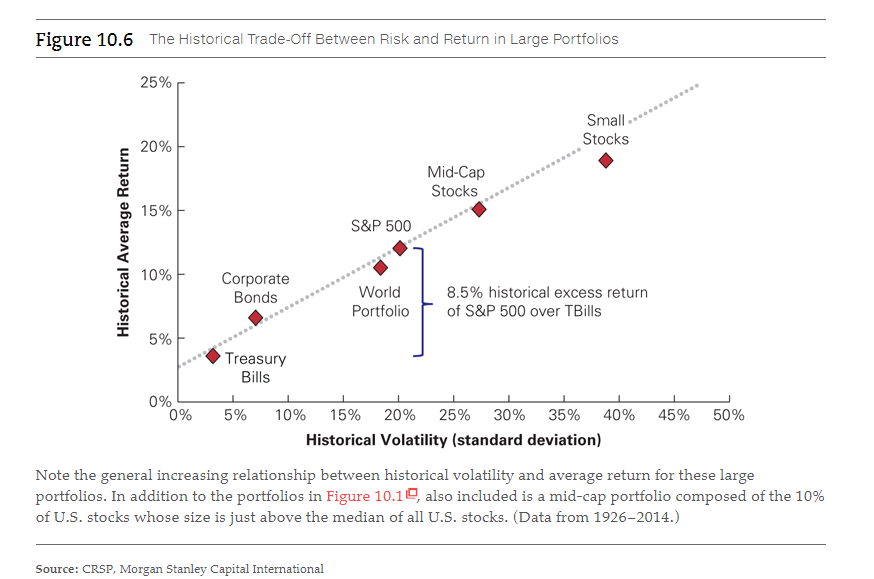
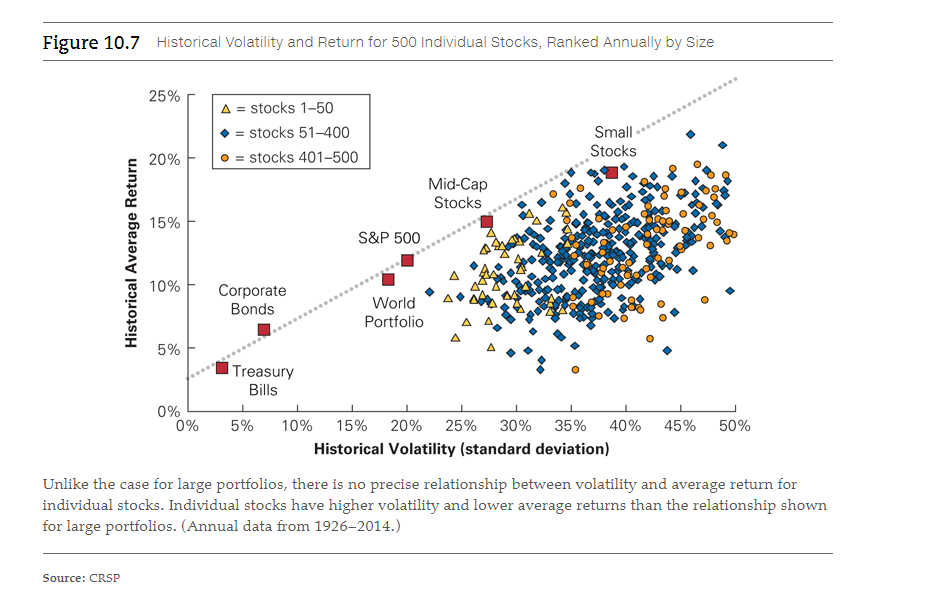
(1) CAPM predicts that a security's risk premium increase in proportion to its beta of the security, not its volatility. Justify this statement using Figures 10.6 and 10.7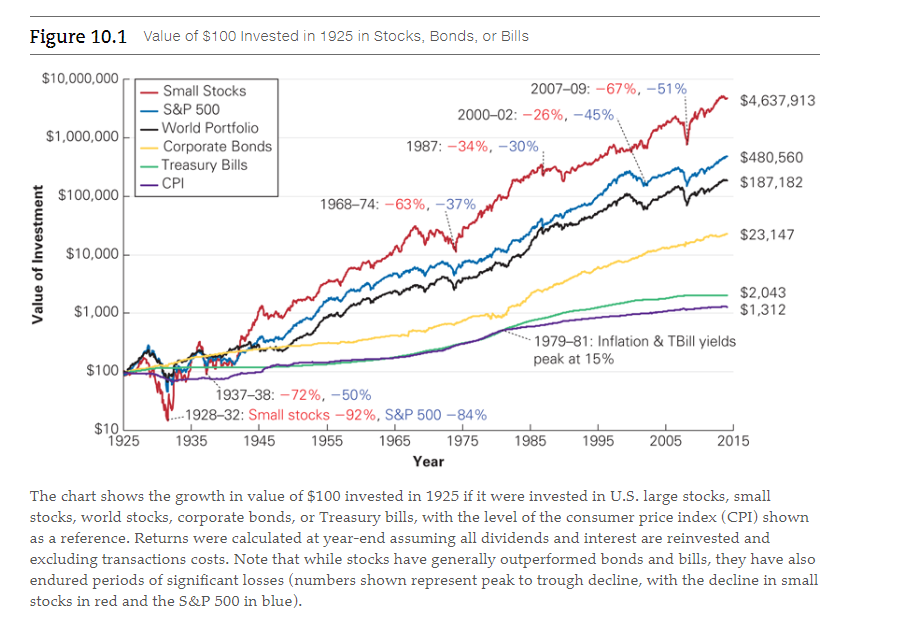
(2) Explain why CAPM (is used)!
(3) Discuss about differences/advantages of the three different valuation methods (WACC, APV, and FTE).
(4) In Chapter 19, proposed purchase price was $150 million. Assess whether the valuation results make sense.
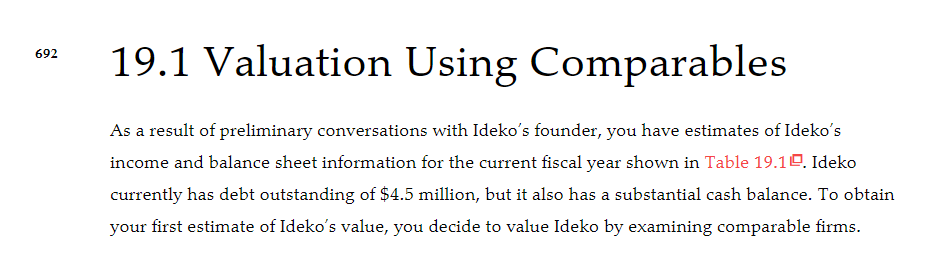
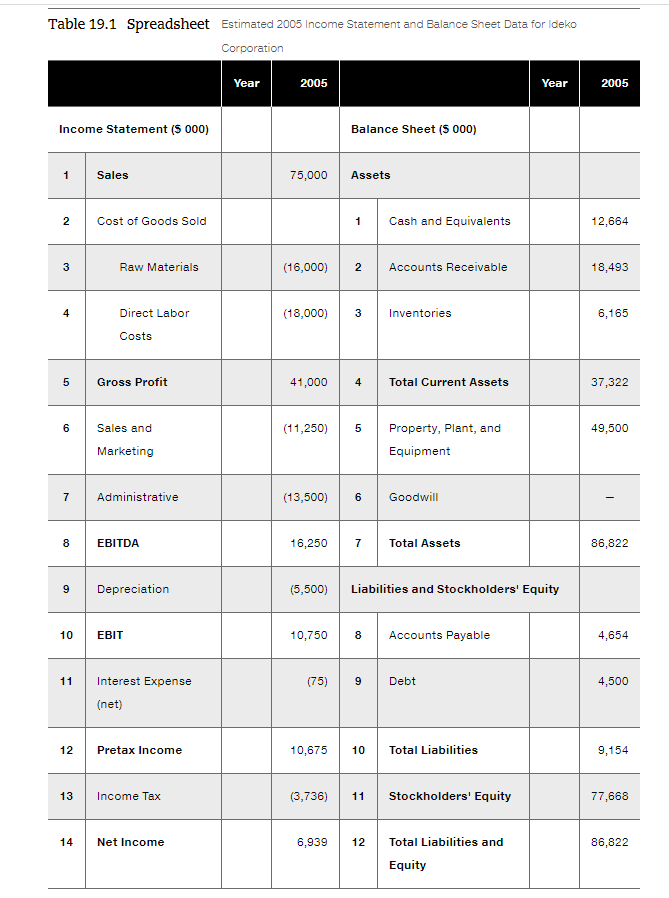
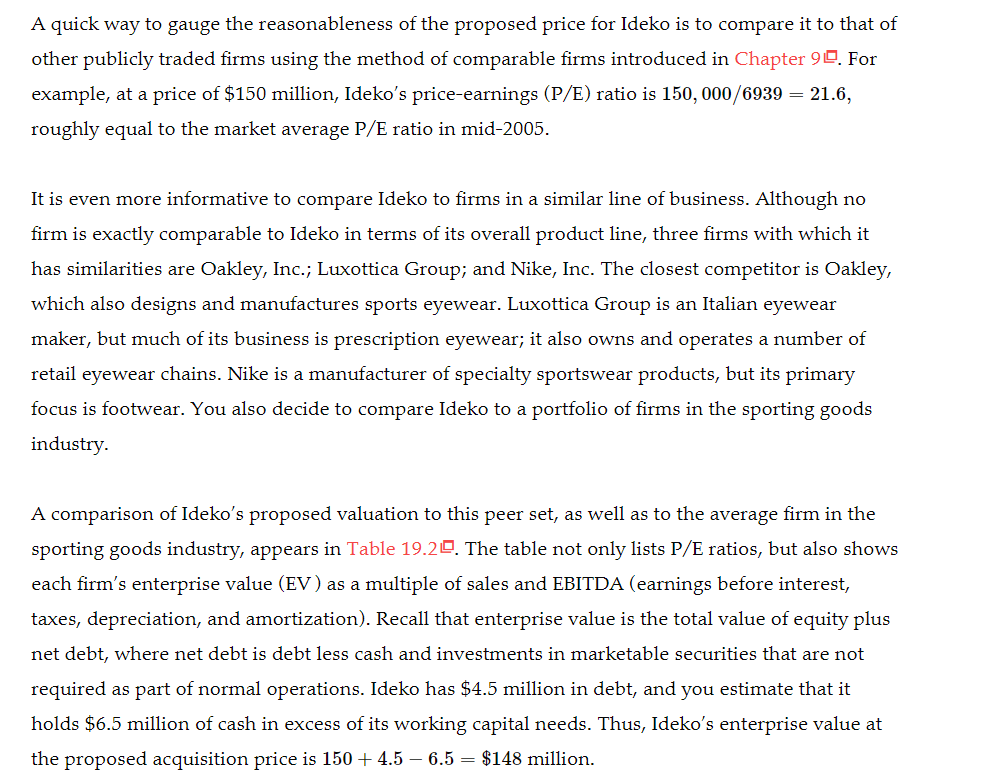
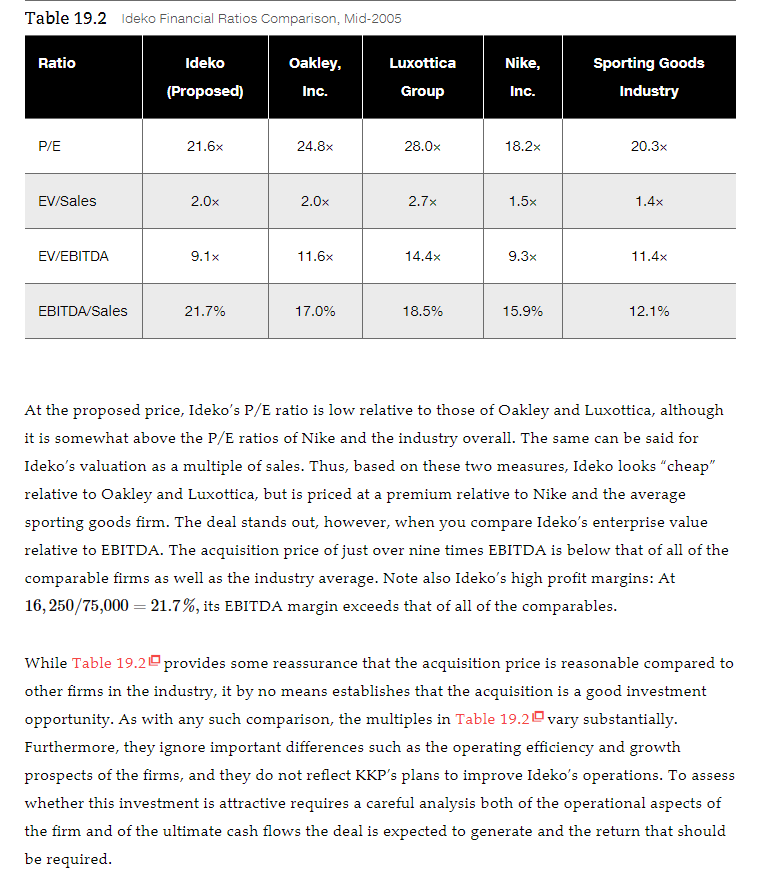
Figure 10.1 Value of $100 Invested in 1925 in Stocks, Bonds, or Bills $10,000,000 200709: -67%, -51% 2000-02: -26%, -45% $4,637,913 $1,000,000 Small Stocks S&P 500 - World Portfolio Corporate Bonds - Treasury Bills CPI mon 1987: -34%, -30% $480,560 $187,182 $100,000 1968-74: -63%, -37% $23,147 Value of Investment $10,000 $1,000 $2,043 $1,312 - 1979-81: Inflation & TBill yields peak at 15% $100 $10 1925 1937-38: -72%, -50% -1928-32: Small stocks -92%, S&P 500 -84% 1935 1945 1955 1965 1975 Year 1985 1995 2005 2015 The chart shows the growth in value of $100 invested in 1925 if it were invested in U.S. large stocks, small stocks, world stocks, corporate bonds, or Treasury bills, with the level of the consumer price index (CPI) shown as a reference. Returns were calculated at year-end assuming all dividends and interest are reinvested and excluding transactions costs. Note that while stocks have generally outperformed bonds and bills, they have also endured periods of significant losses (numbers shown represent peak to trough decline, with the decline in small stocks in red and the S&P 500 in blue). Figure 10.6 The Historical Trade-off Between Risk and Return in Large Portfolios 25% Small Stocks 20% Mid-Cap Stocks 15% S&P 500 Historical Average Return 10% Corporate World Bonds 8.5% historical excess return Portfolio of S&P 500 over TBills 5% Treasury Bills 0% 0% 5% 10% 15% 20% 25% 30% 35% 40% 45% 50% Historical Volatility (standard deviation) Note the general increasing relationship between historical volatility and average return for these large portfolios. In addition to the portfolios in Figure 10.10, also included is a mid-cap portfolio composed of the 10% of U.S. stocks whose size is just above the median of all U.S. stocks. (Data from 1926-2014.) Source: CRSP, Morgan Stanley Capital International Figure 10.7 Historical Volatility and Return for 500 Individual stocks, Ranked Annually by Size 25% A = stocks 1-50 = stocks 51-400 = stocks 401-500 Small Stocks 20% Mid-Cap Stocks 15% S&P 500 Historical Average Return 10% Corporate Bonds World Portfolio 5% Treasury Bills 0% 0% 5% 10% 15% 20% 25% 30% 35% 40% 45% 50% Historical Volatility (standard deviation) Unlike the case for large portfolios, there is no precise relationship between volatility and average return for individual stocks. Individual stocks have higher volatility and lower average returns than the relationship shown for large portfolios. (Annual data from 1926-2014.) Source: CRSP 692 19.1 Valuation Using Comparables As a result of preliminary conversations with Ideko's founder, you have estimates of Ideko's income and balance sheet information for the current fiscal year shown in Table 19.10. Ideko currently has debt outstanding of $4.5 million, but it also has a substantial cash balance. To obtain your first estimate of Ideko's value, you decide to value Ideko by examining comparable firms. Table 19.1 Spreadsheet Estimated 2005 Income Statement and Balance Sheet Data for Ideko Corporation Year 2005 Year 2005 Income Statement ($ 000) Balance Sheet ($ 000) 1 Sales 75,000 Assets 2 Cost of Goods Sold 1 Cash and Equivalents 12,664 Raw Materials (16,000) 2 Accounts Receivable 18,493 4 Direct Labor (18,000) 3 Inventories 6,165 Costs 5 Gross Profit 41,000 4 Total Current Assets 37,322 6 (11,250) 5 49,500 Sales and Marketing Property, plant, and Equipment 7 Administrative (13,500) 6 Goodwill 8 EBITDA 16,250 7 Total Assets 86,822 9 Depreciation (5,500) Liabilities and Stockholders' Equity 10 EBIT 10,750 8 Accounts Payable 4,654 11 (75) 9 Debt 4,500 Interest Expense (net) 12 Pretax Income 10,675 10 Total Liabilities 9,154 13 Income Tax (3,736) 11 Stockholders' Equity 77,668 14 Net Income 6,939 12 86,822 Total Liabilities and Equity A quick way to gauge the reasonableness of the proposed price for Ideko is to compare it to that of other publicly traded firms using the method of comparable firms introduced in Chapter 90. For example, at a price of $150 million, Ideko's price-earnings (P/E) ratio is 150,000/6939 = 21.6, roughly equal to the market average P/E ratio in mid-2005. It is even more informative to compare Ideko to firms in a similar line of business. Although no firm is exactly comparable to Ideko in terms of its overall product line, three firms with which it has similarities are Oakley, Inc.; Luxottica Group; and Nike, Inc. The closest competitor is Oakley, which also designs and manufactures sports eyewear. Luxottica Group is an Italian eyewear maker, but much of its business is prescription eyewear; it also owns and operates a number of retail eyewear chains. Nike is a manufacturer of specialty sportswear products, but its primary focus is footwear. You also decide to compare Ideko to a portfolio of firms in the sporting goods industry. A comparison of Ideko's proposed valuation to this peer set, as well as to the average firm in the sporting goods industry, appears in Table 19.20. The table not only lists P/E ratios, but also shows each firm's enterprise value (EV) as a multiple of sales and EBITDA (earnings before interest, taxes, depreciation, and amortization). Recall that enterprise value is the total value of equity plus net debt, where net debt is debt less cash and investments in marketable securities that are not required as part of normal operations. Ideko has $4.5 million in debt, and you estimate that it holds $6.5 million of cash in excess of its working capital needs. Thus, Ideko's enterprise value the proposed acquisition price is 150+ 4.5 - 6.5 = $148 million. Table 19.2 Ideko Financial Ratios Comparison, Mid-2005 Ratio Nike, Ideko (Proposed) Oakley, Inc. Luxottica Group Sporting Goods Industry Inc. P/E 21.6x 24.8x 28.0x 18.2x 20.3x EV/Sales 2.0x 2.0x 2.7x 1.5x 1.4x EV/EBITDA 9.1x 11.6x 14.4x 9.3x 11.4x EBITDA/Sales 21.7% 17.0% 18.5% 15.9% 12.1% At the proposed price, Ideko's P/E ratio is low relative to those of Oakley and Luxottica, although it is somewhat above the P/E ratios of Nike and the industry overall. The same can be said for Ideko's valuation as a multiple of sales. Thus, based on these two measures, Ideko looks "cheap" relative to Oakley and Luxottica, but is priced at a premium relative to Nike and the average sporting goods firm. The deal stands out, however, when you compare Ideko's enterprise value relative to EBITDA. The acquisition price of just over nine times EBITDA is below that of all of the comparable firms as well as the industry average. Note also Ideko's high profit margins: At 16,250/75,000 = 21.7%, its EBITDA margin exceeds that of all of the comparables. While Table 19.2 provides some reassurance that the acquisition price is reasonable compared to other firms in the industry, it by no means establishes that the acquisition is a good investment opportunity. As with any such comparison, the multiples in Table 19.20 vary substantially. Furthermore, they ignore important differences such as the operating efficiency and growth prospects of the firms, and they do not reflect KKP's plans to improve Ideko's operations. To assess whether this investment is attractive requires a careful analysis both of the operational aspects of the firm and of the ultimate cash flows the deal is expected to generate and the return that should be required. Figure 10.1 Value of $100 Invested in 1925 in Stocks, Bonds, or Bills $10,000,000 200709: -67%, -51% 2000-02: -26%, -45% $4,637,913 $1,000,000 Small Stocks S&P 500 - World Portfolio Corporate Bonds - Treasury Bills CPI mon 1987: -34%, -30% $480,560 $187,182 $100,000 1968-74: -63%, -37% $23,147 Value of Investment $10,000 $1,000 $2,043 $1,312 - 1979-81: Inflation & TBill yields peak at 15% $100 $10 1925 1937-38: -72%, -50% -1928-32: Small stocks -92%, S&P 500 -84% 1935 1945 1955 1965 1975 Year 1985 1995 2005 2015 The chart shows the growth in value of $100 invested in 1925 if it were invested in U.S. large stocks, small stocks, world stocks, corporate bonds, or Treasury bills, with the level of the consumer price index (CPI) shown as a reference. Returns were calculated at year-end assuming all dividends and interest are reinvested and excluding transactions costs. Note that while stocks have generally outperformed bonds and bills, they have also endured periods of significant losses (numbers shown represent peak to trough decline, with the decline in small stocks in red and the S&P 500 in blue). Figure 10.6 The Historical Trade-off Between Risk and Return in Large Portfolios 25% Small Stocks 20% Mid-Cap Stocks 15% S&P 500 Historical Average Return 10% Corporate World Bonds 8.5% historical excess return Portfolio of S&P 500 over TBills 5% Treasury Bills 0% 0% 5% 10% 15% 20% 25% 30% 35% 40% 45% 50% Historical Volatility (standard deviation) Note the general increasing relationship between historical volatility and average return for these large portfolios. In addition to the portfolios in Figure 10.10, also included is a mid-cap portfolio composed of the 10% of U.S. stocks whose size is just above the median of all U.S. stocks. (Data from 1926-2014.) Source: CRSP, Morgan Stanley Capital International Figure 10.7 Historical Volatility and Return for 500 Individual stocks, Ranked Annually by Size 25% A = stocks 1-50 = stocks 51-400 = stocks 401-500 Small Stocks 20% Mid-Cap Stocks 15% S&P 500 Historical Average Return 10% Corporate Bonds World Portfolio 5% Treasury Bills 0% 0% 5% 10% 15% 20% 25% 30% 35% 40% 45% 50% Historical Volatility (standard deviation) Unlike the case for large portfolios, there is no precise relationship between volatility and average return for individual stocks. Individual stocks have higher volatility and lower average returns than the relationship shown for large portfolios. (Annual data from 1926-2014.) Source: CRSP 692 19.1 Valuation Using Comparables As a result of preliminary conversations with Ideko's founder, you have estimates of Ideko's income and balance sheet information for the current fiscal year shown in Table 19.10. Ideko currently has debt outstanding of $4.5 million, but it also has a substantial cash balance. To obtain your first estimate of Ideko's value, you decide to value Ideko by examining comparable firms. Table 19.1 Spreadsheet Estimated 2005 Income Statement and Balance Sheet Data for Ideko Corporation Year 2005 Year 2005 Income Statement ($ 000) Balance Sheet ($ 000) 1 Sales 75,000 Assets 2 Cost of Goods Sold 1 Cash and Equivalents 12,664 Raw Materials (16,000) 2 Accounts Receivable 18,493 4 Direct Labor (18,000) 3 Inventories 6,165 Costs 5 Gross Profit 41,000 4 Total Current Assets 37,322 6 (11,250) 5 49,500 Sales and Marketing Property, plant, and Equipment 7 Administrative (13,500) 6 Goodwill 8 EBITDA 16,250 7 Total Assets 86,822 9 Depreciation (5,500) Liabilities and Stockholders' Equity 10 EBIT 10,750 8 Accounts Payable 4,654 11 (75) 9 Debt 4,500 Interest Expense (net) 12 Pretax Income 10,675 10 Total Liabilities 9,154 13 Income Tax (3,736) 11 Stockholders' Equity 77,668 14 Net Income 6,939 12 86,822 Total Liabilities and Equity A quick way to gauge the reasonableness of the proposed price for Ideko is to compare it to that of other publicly traded firms using the method of comparable firms introduced in Chapter 90. For example, at a price of $150 million, Ideko's price-earnings (P/E) ratio is 150,000/6939 = 21.6, roughly equal to the market average P/E ratio in mid-2005. It is even more informative to compare Ideko to firms in a similar line of business. Although no firm is exactly comparable to Ideko in terms of its overall product line, three firms with which it has similarities are Oakley, Inc.; Luxottica Group; and Nike, Inc. The closest competitor is Oakley, which also designs and manufactures sports eyewear. Luxottica Group is an Italian eyewear maker, but much of its business is prescription eyewear; it also owns and operates a number of retail eyewear chains. Nike is a manufacturer of specialty sportswear products, but its primary focus is footwear. You also decide to compare Ideko to a portfolio of firms in the sporting goods industry. A comparison of Ideko's proposed valuation to this peer set, as well as to the average firm in the sporting goods industry, appears in Table 19.20. The table not only lists P/E ratios, but also shows each firm's enterprise value (EV) as a multiple of sales and EBITDA (earnings before interest, taxes, depreciation, and amortization). Recall that enterprise value is the total value of equity plus net debt, where net debt is debt less cash and investments in marketable securities that are not required as part of normal operations. Ideko has $4.5 million in debt, and you estimate that it holds $6.5 million of cash in excess of its working capital needs. Thus, Ideko's enterprise value the proposed acquisition price is 150+ 4.5 - 6.5 = $148 million. Table 19.2 Ideko Financial Ratios Comparison, Mid-2005 Ratio Nike, Ideko (Proposed) Oakley, Inc. Luxottica Group Sporting Goods Industry Inc. P/E 21.6x 24.8x 28.0x 18.2x 20.3x EV/Sales 2.0x 2.0x 2.7x 1.5x 1.4x EV/EBITDA 9.1x 11.6x 14.4x 9.3x 11.4x EBITDA/Sales 21.7% 17.0% 18.5% 15.9% 12.1% At the proposed price, Ideko's P/E ratio is low relative to those of Oakley and Luxottica, although it is somewhat above the P/E ratios of Nike and the industry overall. The same can be said for Ideko's valuation as a multiple of sales. Thus, based on these two measures, Ideko looks "cheap" relative to Oakley and Luxottica, but is priced at a premium relative to Nike and the average sporting goods firm. The deal stands out, however, when you compare Ideko's enterprise value relative to EBITDA. The acquisition price of just over nine times EBITDA is below that of all of the comparable firms as well as the industry average. Note also Ideko's high profit margins: At 16,250/75,000 = 21.7%, its EBITDA margin exceeds that of all of the comparables. While Table 19.2 provides some reassurance that the acquisition price is reasonable compared to other firms in the industry, it by no means establishes that the acquisition is a good investment opportunity. As with any such comparison, the multiples in Table 19.20 vary substantially. Furthermore, they ignore important differences such as the operating efficiency and growth prospects of the firms, and they do not reflect KKP's plans to improve Ideko's operations. To assess whether this investment is attractive requires a careful analysis both of the operational aspects of the firm and of the ultimate cash flows the deal is expected to generate and the return that should be required
Step by Step Solution
There are 3 Steps involved in it

Get step-by-step solutions from verified subject matter experts