Answered step by step
Verified Expert Solution
Question
1 Approved Answer
1. Conduct a financial statement and operating indicator analysis and interpret the resulting data. Use both national and state competitor data in the analysis. (Note
1. Conduct a financial statement and operating indicator analysis and interpret the resulting data. Use both national and state competitor data in the analysis. (Note that all ratios do not have a complete set of comparative data) 

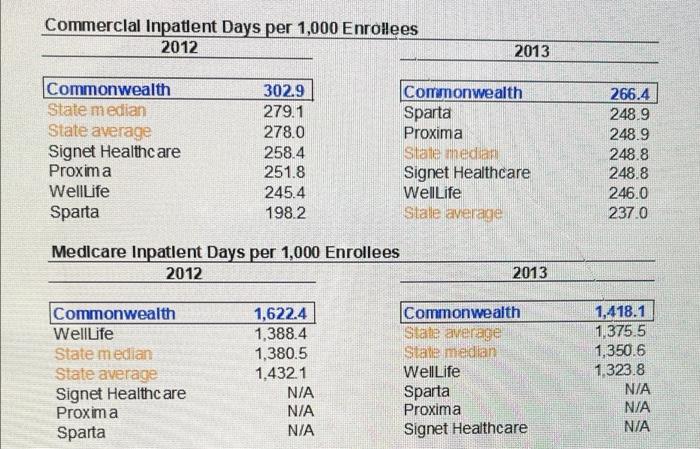
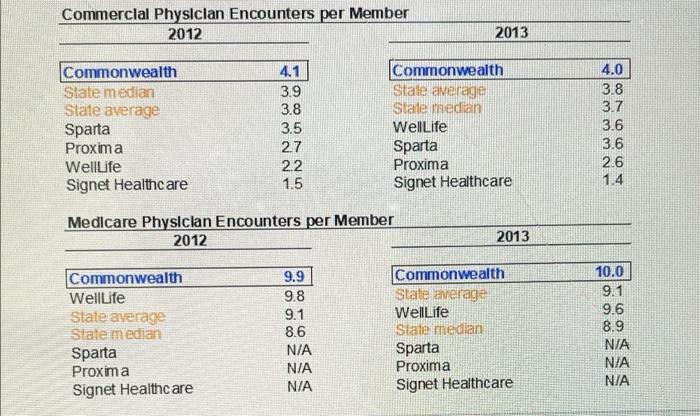
Commercial Inpatient Days per 1,000 Enrollees 2012 2013 Commonwealth State median State average Signet Healthcare Proxima WellLife Sparta 302.9 279.1 278.0 258.4 251.8 245.4 198.2 Commonwealth Sparta Proxima State median Signet Healthcare Well Life Stale average 266.4 248.9 248.9 248.8 248.8 246.0 237.0 Medicare Inpatient Days per 1,000 Enrollees 2012 2013 Commonwealth Welllife State median State average Signet Healthcare Proxima Sparta 1,622.4 1,388.4 1,380.5 1.432.1 N/A N/A N/A Commonwealth State average State median WellLife Sparta Proxima Signet Healthcare 1,418.1 1,375,5 1,350.6 1,323.8 N/A N/A N/A Commercial Physician Encounters per Member 2012 2013 Commonwealth Siate median State average Sparta Proxima Welllife Signet Healthcare 4.1 3.9 3.8 3.5 2.7 2.2 1.5 Commonwealth Stale average Stale median WellLife Sparta Proxima Signet Healthcare 4.0 3.8 3.7 3.6 3.6 2.6 1.4 Medicare Physician Encounters per Member 2012 2013 10.0 9.1 9.6 Commonwealth WellLife State average State median Sparta Proxima Signet Healthcare 9.9 9.8 9.1 8.6 N/A N/A N/A Commonwealth State average WellLife Stale median Sparta Proxima Signet Healthcare 8.9 NIA a. Explain usage indicators


Step by Step Solution
There are 3 Steps involved in it
Step: 1

Get Instant Access to Expert-Tailored Solutions
See step-by-step solutions with expert insights and AI powered tools for academic success
Step: 2

Step: 3

Ace Your Homework with AI
Get the answers you need in no time with our AI-driven, step-by-step assistance
Get Started


