Answered step by step
Verified Expert Solution
Question
1 Approved Answer
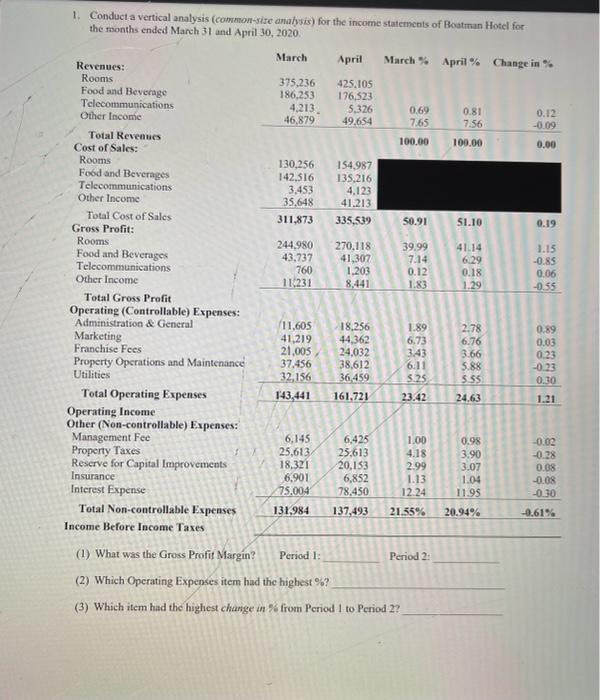
1. Conduct a vertical analysis (common-size analysis) for the income statements of Boatman Hotel for the months ended March 31 and April 30, 2020.


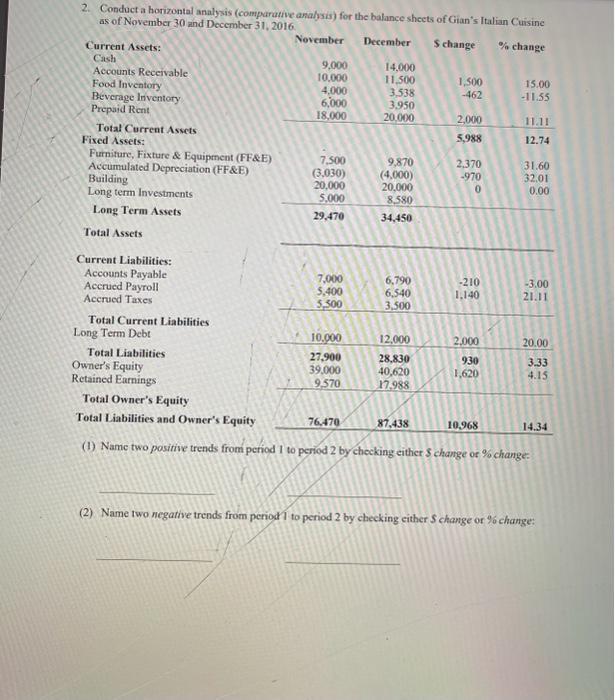
1. Conduct a vertical analysis (common-size analysis) for the income statements of Boatman Hotel for the months ended March 31 and April 30, 2020. March March % April % Change in % Revenues: Rooms Food and Beverage Telecommunications Other Income Total Revenues Cost of Sales: Rooms Food and Beverages Telecommunications Other Income Total Cost of Sales Gross Profit: Rooms Food and Beverages Telecommunications Other Income Total Gross Profit Operating (Controllable) Expenses: Administration & General Marketing Franchise Fees Property Operations and Maintenance Utilities Total Operating Expenses Operating Income Other (Non-controllable) Expenses: Management Fee Property Taxes Reserve for Capital Improvements Insurance Interest Expense Total Non-controllable Expenses 375,236 186,253 4,213 46.879 130,256 142,516 3,453 35,648 311,873 244,980 43,737 760 11/231 11,605 41,219 21,005 37,456 32,156 143,441 April 425,105 176,523 6,901 75.004 131.984 5,326 49,654 154,987 135,216 4,123 41.213 335,539 270,118 41,307 1,203 8,441 18,256 44,362 24.032 38,612 36,459 161,721 0.69 7.65 100.00 50.91 39.99 7.14 0.12 1.83 1.89 6.73 3.43 6.11 5.25 23.42 6,145 6,425 1.00 25,613 25.613 4.18 18,321 20,153 2.99 6,852 1.13 78,450 12.24 137,493 21.55% Income Before Income Taxes (1) What was the Gross Profit Margin? Period 1: (2) Which Operating Expenses item had the highest %? (3) Which item had the highest change in % from Period 1 to Period 2? Period 2: 0.81 7.56 100.00 51.10 41.14 6.29 0.18 1.29 2.78 6.76 3.66 5.88 5.55 24.63 0.98 3.90 3.07 1.04 11.95 20.94% 0.12 -0.09 0.00 0.19 1.15 -0.85 0.06 -0.55 0.89 0.03 0.23 -0.23 0.30 1.21 -0.02 -0.28 0.08 -0.08 -0.30 -0.61% 2. Conduct a horizontal analysis (comparative analysis) for the balance sheets of Gian's Italian Cuisine as of November 30 and December 31, 2016. November December S change % change Current Assets: Cash Accounts Receivable Food Inventory Beverage Inventory Prepaid Rent Total Current Assets Fixed Assets: Furniture, Fixture & Equipment (FF&E) Accumulated Depreciation (FF&E) Building Long term Investments Long Term Assets Total Assets Current Liabilities: Accounts Payable Accrued Payroll Accrued Taxes Total Current Liabilities Long Term Debt Total Liabilities Owner's Equity Retained Earnings 9,000 10,000 4,000 6,000 18,000 7,500 (3.030) 20,000 5,000 29,470 7,000 5,400 5,500 10.000 27,900 39,000 9,570 14.000 11,500 3,538 3.950 20,000 9,870 (4,000) 20,000 8,580 34,450 6,790 6,540 3,500 12,000 28,830 40,620 17,988 1,500 -462 87,438 2,000 5,988 2,370 -970 0 -210 1,140 2,000 930 1,620 15.00 -11.55 10,968 11.11 12.74 31.60 32.01 0.00 -3.00 21.11 Total Owner's Equity Total Liabilities and Owner's Equity 76,470 (1) Name two positive trends from period I to period 2 by checking either $ change or % change: 20.00 3.33 4.15 14.34 (2) Name two negative trends from period 1 to period 2 by checking either S change or % change:
Step by Step Solution
★★★★★
3.44 Rating (157 Votes )
There are 3 Steps involved in it
Step: 1

Get Instant Access to Expert-Tailored Solutions
See step-by-step solutions with expert insights and AI powered tools for academic success
Step: 2

Step: 3

Ace Your Homework with AI
Get the answers you need in no time with our AI-driven, step-by-step assistance
Get Started


