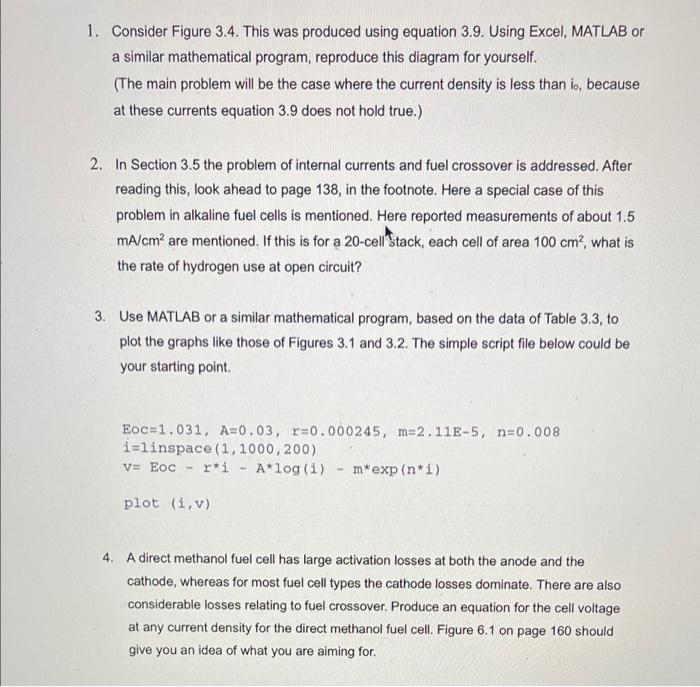
Question: 1. Consider Figure 3.4. This was produced using equation 3.9. Using Excel, MATLAB or a similar mathematical program, reproduce this diagram for yourself. (The main


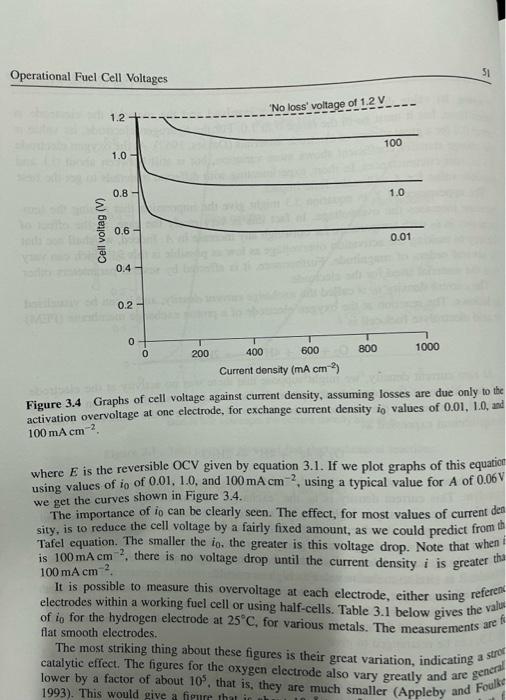
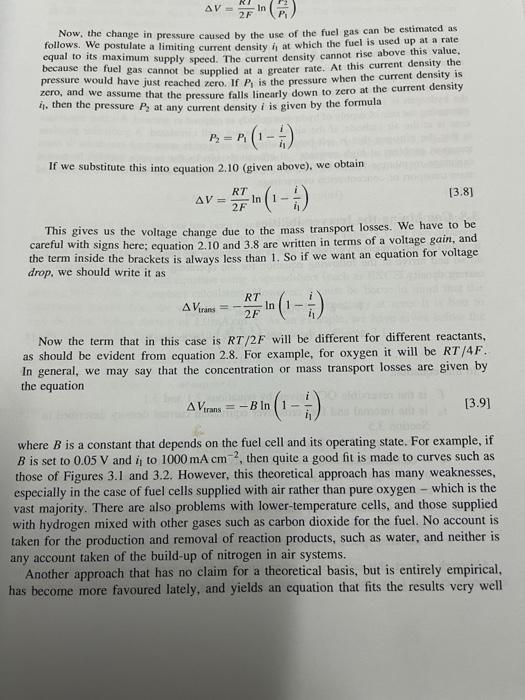
1. Consider Figure 3.4. This was produced using equation 3.9. Using Excel, MATLAB or a similar mathematical program, reproduce this diagram for yourself. (The main problem will be the case where the current density is less than io, because at these currents equation 3.9 does not hold true.) 2. In Section 3.5 the problem of internal currents and fuel crossover is addressed. After reading this, look ahead to page 138, in the footnote. Here a special case of this problem in alkaline fuel cells is mentioned. Here reported measurements of about 1.5 mA/cm2 are mentioned. If this is for a 20-cell Stack, each cell of area 100 cm?, what is the rate of hydrogen use at open circuit? 3. Use MATLAB or a similar mathematical program, based on the data of Table 3.3, to plot the graphs like those of Figures 3.1 and 3.2. The simple script file below could be your starting point Eoc=1.031, A=0.03, r=0.000245, m=2.11E-5, n=0.008 i=linspace(1, 1000, 200) V= Eoc r*i - A*log(i) - m*exp(n+i) plot (i,v) 4. A direct methanol fuel cell has large activation losses at both the anode and the cathode, whereas for most fuel cell types the cathode losses dominate. There are also considerable losses relating to fuel crossover. Produce an equation for the cell voltage at any current density for the direct methanol fuel cell. Figure 6.1 on page 160 should give you an idea of what you are aiming for Operational Fuel Cell Voltages 51 "No loss' voltage of 1.2V 1.2 100 1.0 0.8 1.0 Ceil voltag (V) 0.6 0.01 0.4 0.2 0 0 200 400 600 800 1000 Current density (mA cm) Figure 3.4 Graphs of cell voltage against current density, assuming losses are due only to the activation overvoltage at one electrode, for exchange current density in values of 0.01, 10, and 100 mA cm2 . where E is the reversible OCV given by equation 3.1. If we plot graphs of this equation using values of io of 0.01, 1.0, and 100 mA cm ?, using a typical value for A of 0.06 we get the curves shown in Figure 3.4. The importance of io can be clearly seen. The effect, for most values of current des sity, is to reduce the cell voltage by a fairly fixed amount, as we could predict from thi Tafel equation. The smaller the io, the greater is this voltage drop. Note that when! is 100 mA cm ? there is no voltage drop until the current density i is greater tha 100 mA cm It is possible to measure this overvoltage at each electrode, either using referent electrodes within a working fuel cell or using half-cells. Table 3.1 below gives the valu of io for the hydrogen electrode at 25C, for various metals. The measurements are flat smooth electrodes. The most striking thing about these figures is their great variation, indicating catalytic effect. The figures for the oxygen electrode also vary greatly and are general lower by a factor of about 10, that is, they are much smaller (Appleby and Foulk 1993). This would give a figure that a strer AV 2F Now, the change in pressure caused by the use of the fuel gas can be estimated as follows. We postulate a limiting current density at which the fuel is used up at a rate equal to its maximum supply speed. The current density cannot rise above this value. because the fuel gas cannot be supplied at a greater rate. At this current density the pressure would have just reached zero. If is the pressure when the current density is zero, and we assume that the pressure falls linearly down to zero at the current density . then the pressure at any current density i is given by the formula P=P If we substitute this into equation 2.10 (given above), we obtain RT AV= 2F [3.8] In 1 This gives us the voltage change due to the mass transport losses. We have to be careful with signs here; equation 2.10 and 3.8 are written in terms of a voltage gain, and the term inside the brackets is always less than 1. So if we want an equation for voltage drop, we should write it as A Virans RT 2F In 1- Now the term that in this case is RT/2F will be different for different reactants, as should be evident from equation 2.8. For example, for oxygen it will be RT/4F. In general, we may say that the concentration or mass transport losses are given by the equation AVtrans = B In 1 - [3.91 () where B is a constant that depends on the fuel cell and its operating state. For example, if B is set to 0.05 V and i, to 1000 mA cm ? then quite a good fit is made to curves such as those of Figures 3.1 and 3.2. However, this theoretical approach has many weaknesses, especially in the case of fuel cells supplied with air rather than pure oxygen which is the vast majority. There are also problems with lower-temperature cells, and those supplied with hydrogen mixed with other gases such as carbon dioxide for the fuel. No account is taken for the production and removal of reaction products, such as water, and neither is any account taken of the build-up of nitrogen in air systems. Another approach that has no claim for a theoretical basis, but is entirely empirical. has become more favoured lately, and yields an equation that fits the results very well
Step by Step Solution
There are 3 Steps involved in it

Get step-by-step solutions from verified subject matter experts


