Answered step by step
Verified Expert Solution
Link Copied!

Question

1 Approved Answer

1. Consider two risky stocks, A and B, with expected returns of 21% and 7%, respectively. Stock A has a standard deviation of 19%; Stock
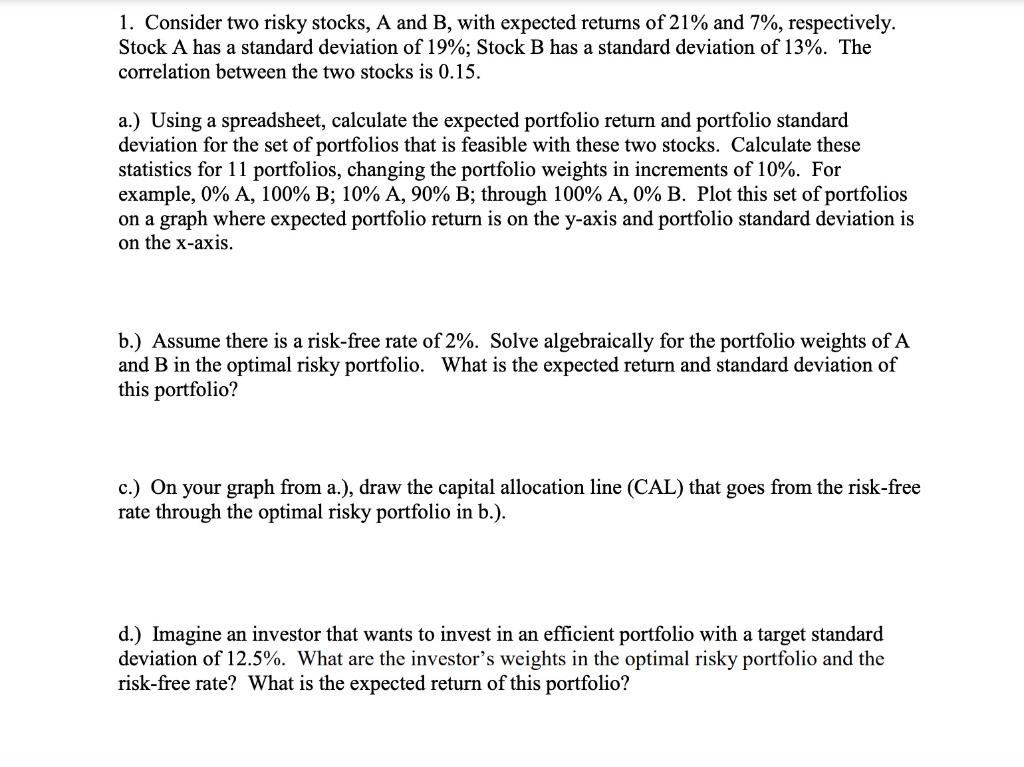
image text in transcribed

1. Consider two risky stocks, A and B, with expected returns of 21% and 7%, respectively. Stock A has a standard deviation of 19%; Stock B has a standard deviation of 13%. The correlation between the two stocks is 0.15. a.) Using a spreadsheet, calculate the expected portfolio return and portfolio standard deviation for the set of portfolios that is feasible with these two stocks. Calculate these statistics for 11 portfolios, changing the portfolio weights in increments of 10%. For example, 0% A, 100% B; 10% A, 90% B; through 100% A, 0% B. Plot this set of portfolios on a graph where expected portfolio return is on the y-axis and portfolio standard deviation is on the x-axis. b.) Assume there is a risk-free rate of 2%. Solve algebraically for the portfolio weights of A and B in the optimal risky portfolio. What is the expected return and standard deviation of this portfolio? c.) On your graph from a.), draw the capital allocation line (CAL) that goes from the risk-free rate through the optimal risky portfolio in b.). d.) Imagine an investor that wants to invest in an efficient portfolio with a target standard deviation of 12.5%. What are the investor's weights in the optimal risky portfolio and the risk-free rate? What is the expected return of this portfolio? 1. Consider two risky stocks, A and B, with expected returns of 21% and 7%, respectively. Stock A has a standard deviation of 19%; Stock B has a standard deviation of 13%. The correlation between the two stocks is 0.15. a.) Using a spreadsheet, calculate the expected portfolio return and portfolio standard deviation for the set of portfolios that is feasible with these two stocks. Calculate these statistics for 11 portfolios, changing the portfolio weights in increments of 10%. For example, 0% A, 100% B; 10% A, 90% B; through 100% A, 0% B. Plot this set of portfolios on a graph where expected portfolio return is on the y-axis and portfolio standard deviation is on the x-axis. b.) Assume there is a risk-free rate of 2%. Solve algebraically for the portfolio weights of A and B in the optimal risky portfolio. What is the expected return and standard deviation of this portfolio? c.) On your graph from a.), draw the capital allocation line (CAL) that goes from the risk-free rate through the optimal risky portfolio in b.). d.) Imagine an investor that wants to invest in an efficient portfolio with a target standard deviation of 12.5%. What are the investor's weights in the optimal risky portfolio and the risk-free rate? What is the expected return of this portfolio

Step by Step Solution

There are 3 Steps involved in it

Step: 1

blur-text-image

Get Instant Access to Expert-Tailored Solutions

See step-by-step solutions with expert insights and AI powered tools for academic success

Step: 2

blur-text-image_2

Step: 3

blur-text-image_3

Ace Your Homework with AI

Get the answers you need in no time with our AI-driven, step-by-step assistance

Get Started

Recommended Textbook for

Finance For Non Financial Managers

Authors: Gene Siciliano

1st Edition

0071413774, 978-0071413770

More Books

Students also viewed these Finance questions

Question

5. Identify the logical fallacies, deceptive forms of reasoning

Answered: 1 week ago

Question

6. Choose an appropriate organizational strategy for your speech

Answered: 1 week ago