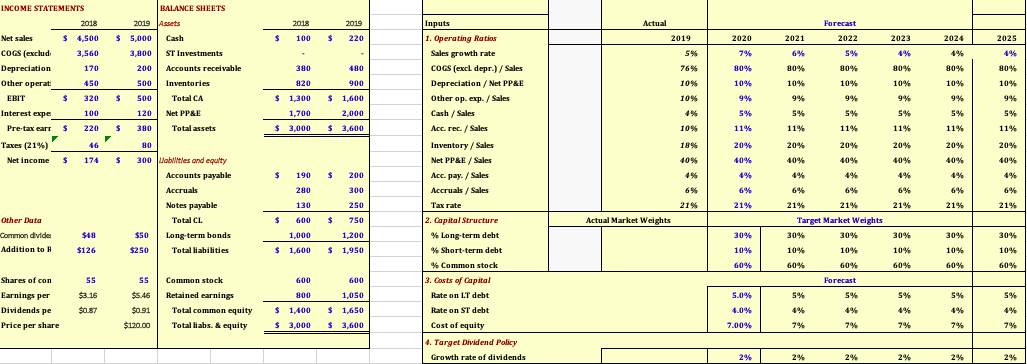
| 1. Construct the table of forecast of operation (Figure 9-3) using provided information |
BALANCE SHEETS Assets Actual 2019 220 Forecast 2022 $ $ 2019 2020 2021 2023 2024 2025 180 5% 76% 80% INCOME STATEMENTS 2018 Net sales $ 4,500 COGS (exclud 3,560 Depreciation 170 Other operat ERIT 320 Interest expe 100 Pre-tax eart $ 220 Taxes (21%) -_ 16 46' Net income $ 174 80% 10% 450 Inputs 1. Operating Ratios Sales growth rate COGS (excl. depr.) / Sales Depreciation / Net PP&E Other op. exp. / Sales Cash / Sales Acc. rec. / Sales 380 820 1,300 900 2019 5,000 3,800 200 500 500 120 380 8 0 300 ST Investments Accounts receivable Inventories Total CA Net PP&E Total assets 1095 80% 10% 9% 80% 10% 9% $ $ $ 1,600 10% 9% 1,700 2.000 $ $ 3,000 $ 3.600 10% 11% 11% 11% 20% 40% $ 40% 5% 80% 80% 10% 10% 9% 5% 11% 20% 40% 40% 4% 6% 6% 21% 21% Target Market Weights 30% 30% 10% 60% 60% Forecast $ 190 280 6% abilities and equity Accounts payable Accruals Notes payable TotalCL Long-term bonds Total liabilities 6% Inventory / Sales Net PP&E / Sales Acc. pay. / Sales Accruals / Sales Tax rate 2. Capital Structure % Long-term debt % Short-term debt 130 21% 21% 21% 21% 200 300 250 750 1,200 1,950 21% 600 $ Actual Market Weights Other Data Common divide Addition to 1,000 30% 30% $40 $126 $50 $250 30% 10% $ 1,600 $ 10% 30% 10% 60% 10% 10% % Common stock 60% 60% 60% 55 600 SS $8.16 $0.87 800 5.0% Shares of con Earnings per Dividends pe Price per share 5% 5% 3. Costs of Capital Rate on LT debt Rate on ST debt $5.46 $0.91 $120.00 Common stock Retained earnings Total common equity Total liabs. & equity 600 1,050 $1,650 $ 3,600 4.0% $1,400 $ 3,000 Cost of equity 7.00% 7% 74 4. Target Dividend Policy Growth rate of dividends 2% 2% 2% 2% 2% BALANCE SHEETS Assets Actual 2019 220 Forecast 2022 $ $ 2019 2020 2021 2023 2024 2025 180 5% 76% 80% INCOME STATEMENTS 2018 Net sales $ 4,500 COGS (exclud 3,560 Depreciation 170 Other operat ERIT 320 Interest expe 100 Pre-tax eart $ 220 Taxes (21%) -_ 16 46' Net income $ 174 80% 10% 450 Inputs 1. Operating Ratios Sales growth rate COGS (excl. depr.) / Sales Depreciation / Net PP&E Other op. exp. / Sales Cash / Sales Acc. rec. / Sales 380 820 1,300 900 2019 5,000 3,800 200 500 500 120 380 8 0 300 ST Investments Accounts receivable Inventories Total CA Net PP&E Total assets 1095 80% 10% 9% 80% 10% 9% $ $ $ 1,600 10% 9% 1,700 2.000 $ $ 3,000 $ 3.600 10% 11% 11% 11% 20% 40% $ 40% 5% 80% 80% 10% 10% 9% 5% 11% 20% 40% 40% 4% 6% 6% 21% 21% Target Market Weights 30% 30% 10% 60% 60% Forecast $ 190 280 6% abilities and equity Accounts payable Accruals Notes payable TotalCL Long-term bonds Total liabilities 6% Inventory / Sales Net PP&E / Sales Acc. pay. / Sales Accruals / Sales Tax rate 2. Capital Structure % Long-term debt % Short-term debt 130 21% 21% 21% 21% 200 300 250 750 1,200 1,950 21% 600 $ Actual Market Weights Other Data Common divide Addition to 1,000 30% 30% $40 $126 $50 $250 30% 10% $ 1,600 $ 10% 30% 10% 60% 10% 10% % Common stock 60% 60% 60% 55 600 SS $8.16 $0.87 800 5.0% Shares of con Earnings per Dividends pe Price per share 5% 5% 3. Costs of Capital Rate on LT debt Rate on ST debt $5.46 $0.91 $120.00 Common stock Retained earnings Total common equity Total liabs. & equity 600 1,050 $1,650 $ 3,600 4.0% $1,400 $ 3,000 Cost of equity 7.00% 7% 74 4. Target Dividend Policy Growth rate of dividends 2% 2% 2% 2% 2%