Answered step by step
Verified Expert Solution
Link Copied!

Question

1 Approved Answer

1. - Data table Stock Percentage of Portfolio Beta Expected Return 1 30% 1.10 2 35% 0.75 3 5% 1.30 4 15% 0.65 5 15%

1.image text in transcribedimage text in transcribed
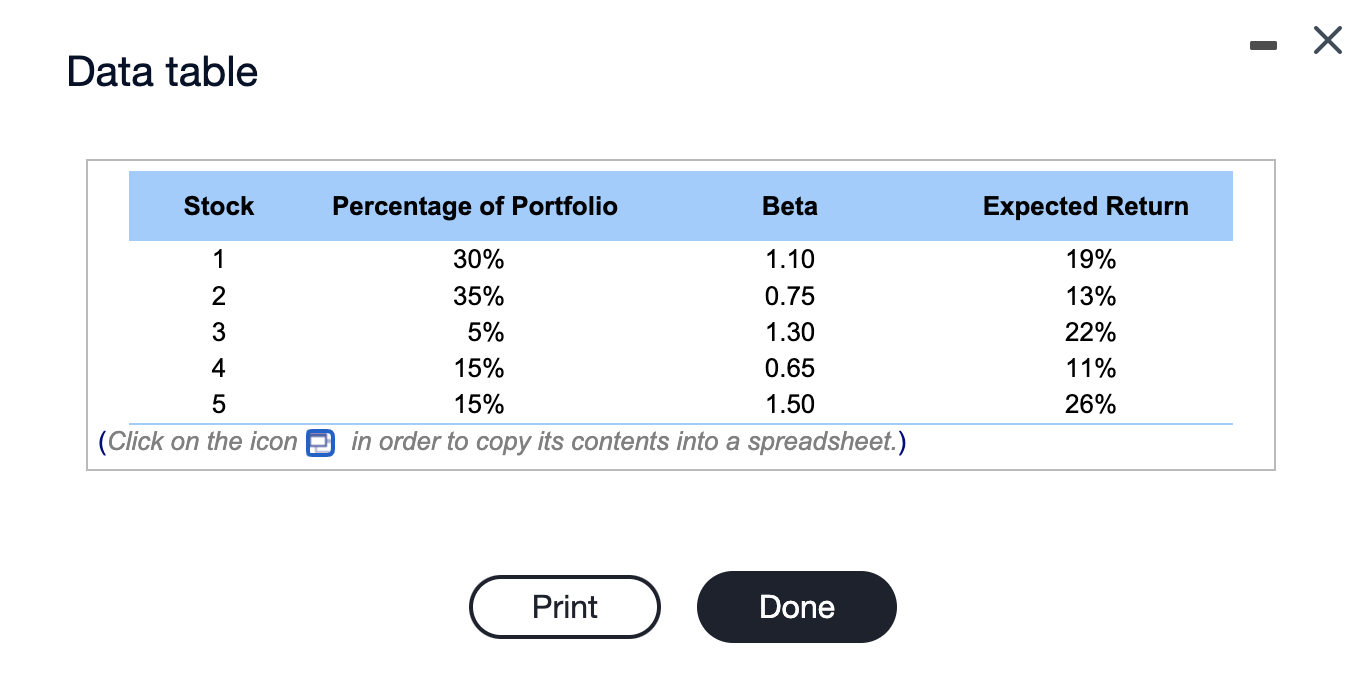
- Data table Stock Percentage of Portfolio Beta Expected Return 1 30% 1.10 2 35% 0.75 3 5% 1.30 4 15% 0.65 5 15% 1.50 (Click on the icon in order to copy its contents into a spreadsheet.) 19% 13% 22% 11% 26% Print Done The risk-free rate is 9 percent. Also, the expected return on (Portfolio beta and security market line) You own a portfolio consisting of the following stocks: the market portfolio is 17 percent. a. Calculate the expected return of your portfolio. (Hint: The expected return of a portfolio equals the weighted average of the individual stock's expected return, where the weights are the percentage invested in each stock.) b. Calculate the portfolio beta. c. Given the preceding information, plot the security market line on paper. Plot the stocks from your portfolio on your graph. d. From your plot in part c, which stocks appear to be your winners and which ones appear to be losers? e. Why should you consider your conclusions in part d to be less than certain? - Data table Stock Percentage of Portfolio Beta Expected Return 1 30% 1.10 2 35% 0.75 3 5% 1.30 4 15% 0.65 5 15% 1.50 (Click on the icon in order to copy its contents into a spreadsheet.) 19% 13% 22% 11% 26% Print Done The risk-free rate is 9 percent. Also, the expected return on (Portfolio beta and security market line) You own a portfolio consisting of the following stocks: the market portfolio is 17 percent. a. Calculate the expected return of your portfolio. (Hint: The expected return of a portfolio equals the weighted average of the individual stock's expected return, where the weights are the percentage invested in each stock.) b. Calculate the portfolio beta. c. Given the preceding information, plot the security market line on paper. Plot the stocks from your portfolio on your graph. d. From your plot in part c, which stocks appear to be your winners and which ones appear to be losers? e. Why should you consider your conclusions in part d to be less than certain

Step by Step Solution

There are 3 Steps involved in it

Step: 1

blur-text-image

Get Instant Access to Expert-Tailored Solutions

See step-by-step solutions with expert insights and AI powered tools for academic success

Step: 2

blur-text-image

Step: 3

blur-text-image

Ace Your Homework with AI

Get the answers you need in no time with our AI-driven, step-by-step assistance

Get Started

Recommended Textbook for

Financial Liberalization And Economic Performance Brazil At The Crossroads

Authors: Luiz Fernando De Paula

1st Edition

0415460093, 978-0415460095

More Books

Students also viewed these Finance questions