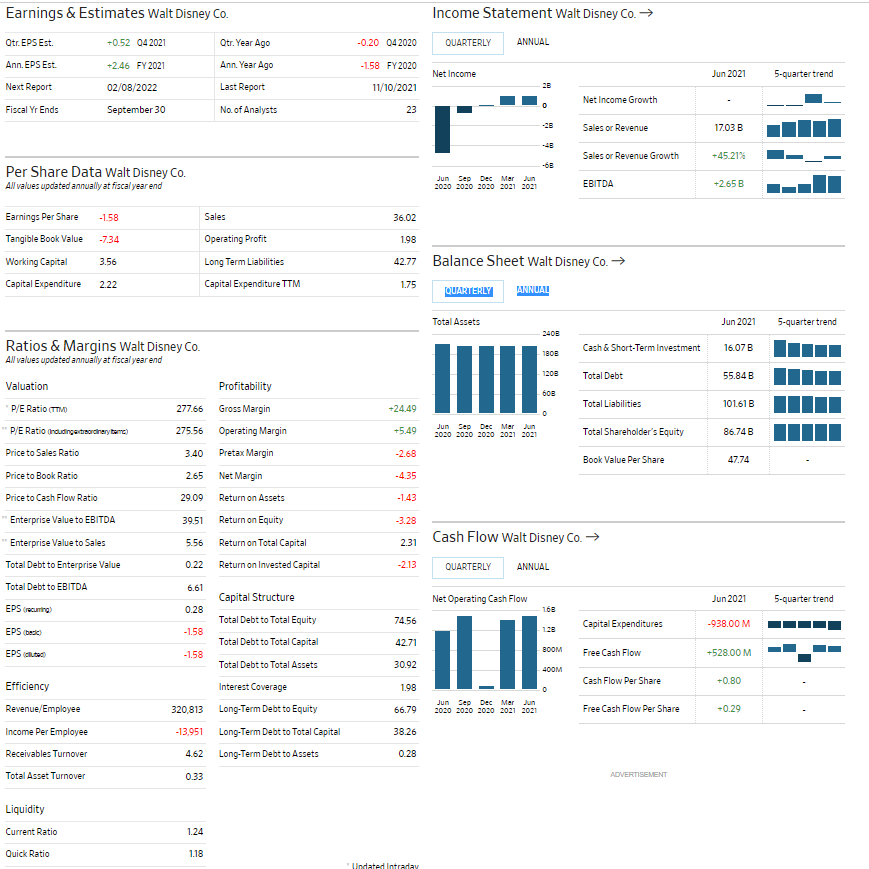
1. Disney Entertainmet`s run a financial statement analysis to determine whether you will invest in the company as a shareholder. 2. Run the analysis as of 2020, and 2019. 3. Use at least 4 ratios (must include current ratio, debt-to-equity ratio, and price/earnings ratio). 4. Use the Ratio Analysis Model 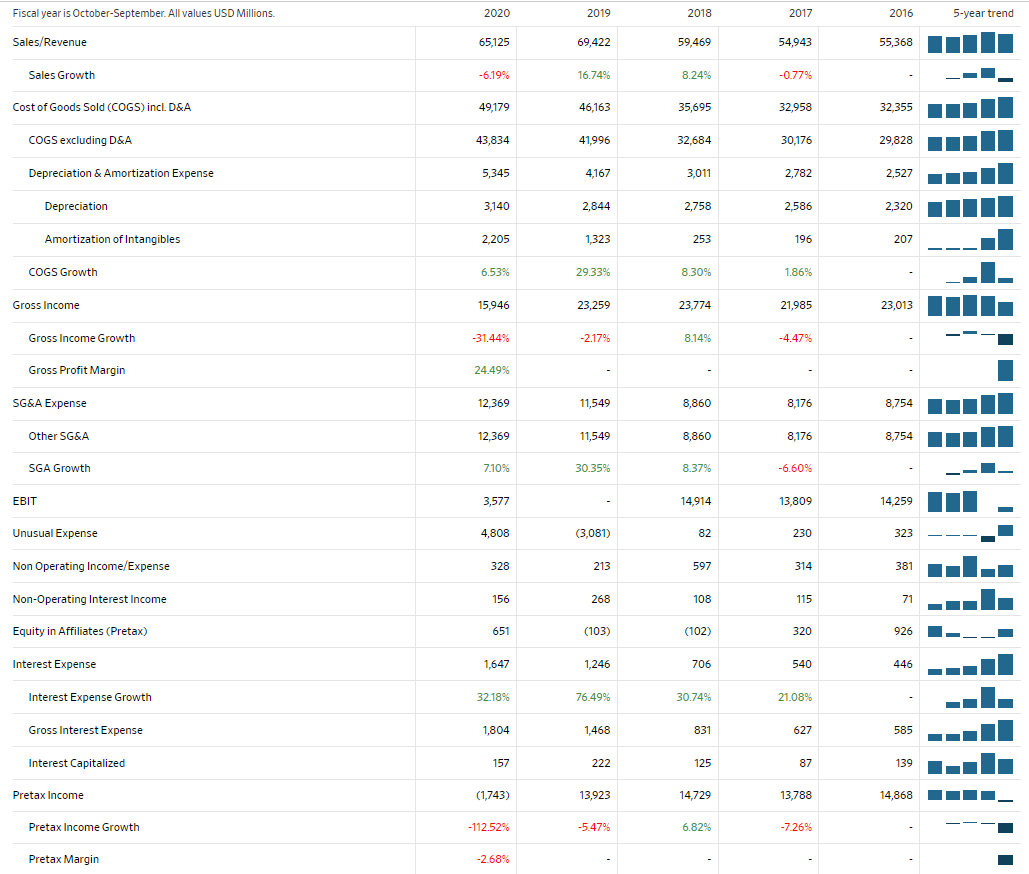
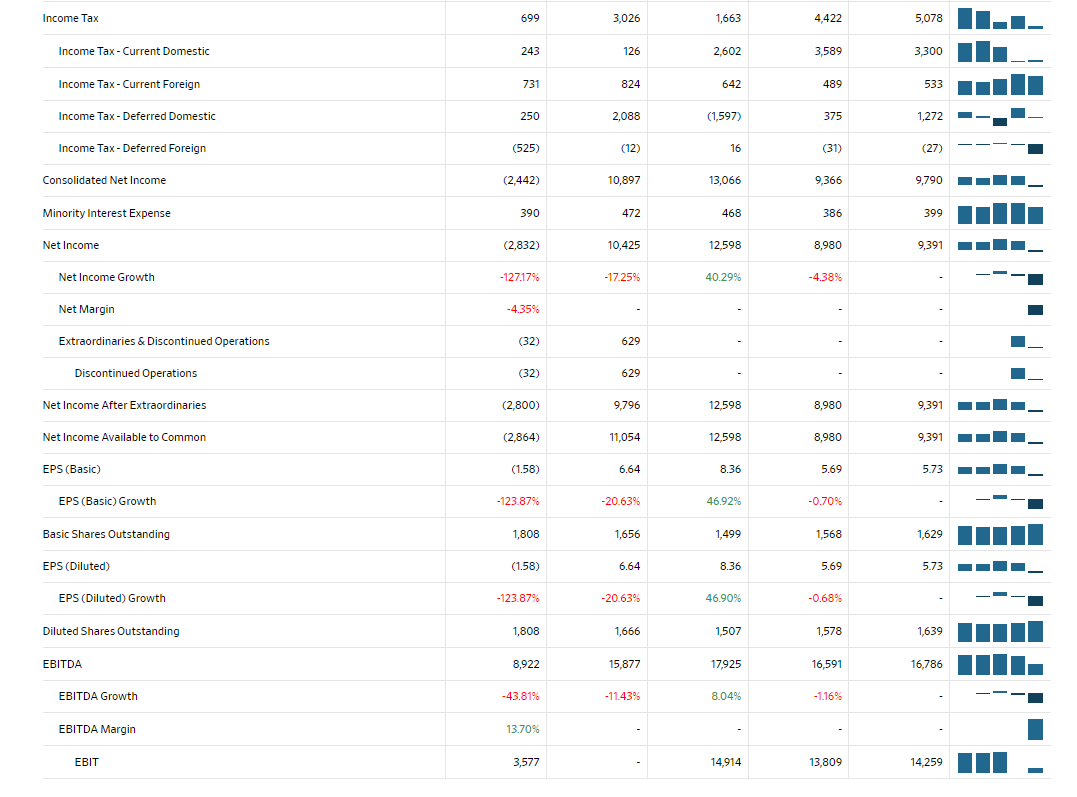
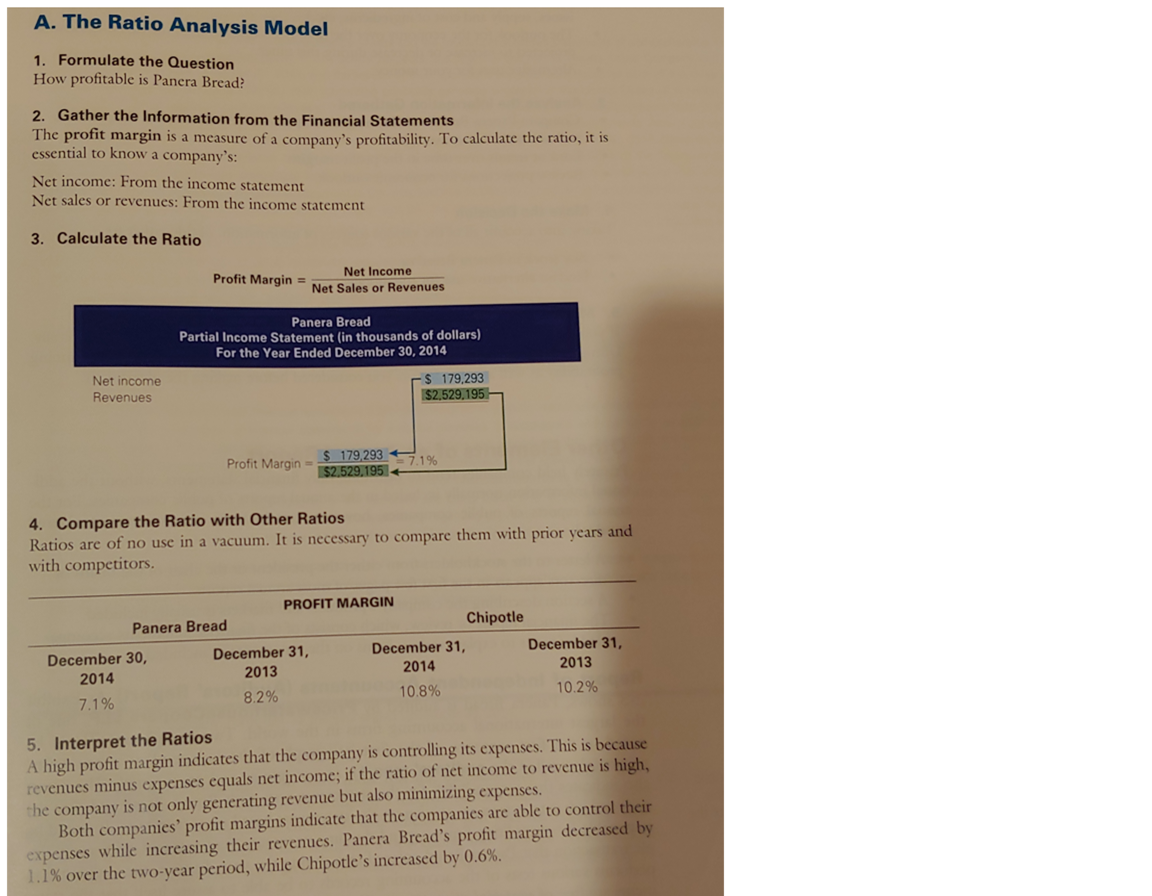
Fiscal year is October September. All values USD Millions. 2020 2019 2018 2017 2016 5-year trend Sales/Revenue 65,125 69,422 59,469 54,943 55,368 Sales Growth -6.19% 16.74% 8.24% -0.77 Cost of Goods Sold (COGS) incl. D&A 49,179 46,163 35,695 32,958 32.355 COGS excluding D&A 43,834 41.996 32,684 30,176 29,828 Depreciation & Amortization Expense 5,345 4,167 3,011 2,782 2,527 Depreciation 3,140 2,844 2,758 2,586 2,320 Amortization of Intangibles 2.205 1.323 253 196 207 COGS Growth 6.53% 29.33% 8.30% 1.86% Gross Income 15.946 23,259 23,774 21,985 23,013 Gross Income Growth -31.44% -2.17% 8.14% -4.47% Gross Profit Margin 24.49% SG&A Expense 12,369 11,549 8,860 8,176 8,754 Other SG&A 12,369 11,549 8,860 8,176 8,754 SGA Growth 7.10% 30.35% 8.37% -6.60% EBIT 3,577 14,914 13,809 14,259 Unusual Expense 4,808 (3,081) 82 230 323 Non Operating Income/Expense 328 213 597 314 381 Non-Operating Interest Income 156 268 108 115 71 Equity in Affiliates (Pretax) 651 (103) (102) 320 926 Interest Expense 1,647 1,246 706 540 446 Interest Expense Growth 32.18% 76.49% 30.74% 21.08% Gross Interest Expense 1,804 1,468 831 627 585 Interest Capitalized 157 222 125 87 139 Pretax Income (1,743) 13,923 14,729 13,788 14,868 Pretax Income Growth -112.52% -5.47% 6.82% -7.26% Pretax Margin -2.68% Income Tax 699 3,026 1,663 4,422 5,078 Income Tax - Current Domestic 243 126 2,602 3.589 3,300 Income Tax - Current Foreign 731 824 642 489 533 Income Tax-Deferred Domestic 250 2,088 (1.597) 375 1,272 Income Tax-Deferred Foreign (525) (12) 16 (31) (27) Consolidated Net Income (2,442) 10,897 13,066 9,366 9,790 Minority Interest Expense 390 472 468 386 399 Net Income (2,832) 10,425 12.598 8,980 9,391 Net Income Growth -127.17% -17.25% 40.29% -4.38% Net Margin -4.35% Extraordinaries & Discontinued Operations (32) 629 Discontinued Operations (32) 629 Net Income After Extraordinaries (2,800) 9,796 12,598 8,980 9,391 Net Income Available to Common (2,864) 11,054 12.598 8,980 9,391 EPS (Basic) (1.58) 6.64 8.36 5.69 5.73 EPS (Basic) Growth -123.87% -20.63% 46.92% -0.70% Basic Shares Outstanding 1,808 1,656 1,499 1,568 1,629 EPS (Diluted) (1.58) 6.64 8.36 5.69 5.73 EPS (Diluted) Growth -123.87% -20.63% 46.90% -0.68% Diluted Shares Outstanding 1,808 1,666 1,507 1,578 1,639 EBITDA 8,922 15,877 17,925 16,591 16,786 EBITDA Growth -43.81% - 11.43% 8.04% -1.16% EBITDA Margin 13.70% EBIT 3,577 14,914 13,809 14,259 A. The Ratio Analysis Model 1. Formulate the Question How profitable is Panera Bread? 2. Gather the Information from the Financial Statements The profit margin is a measure of a company's profitability. To calculate the ratio, it is essential to know a company's: Net income: From the income statement Net sales or revenues: From the income statement 3. Calculate the Ratio Profit Margin = Net Income Net Sales or Revenues Panera Bread Partial Income Statement (in thousands of dollars) For the Year Ended December 30, 2014 Net income Revenues 179.293 $2,529,195 $ 179,293 Profit Margin- $2,529,195 - 7.1% 4. Compare the Ratio with Other Ratios Ratios are of no use in a vacuum. It is necessary to compare them with prior years and with competitors. PROFIT MARGIN Panera Bread Chipotle December 30, December 31, December 31, December 31, 2014 2013 2014 2013 7.1% 8.2% 10.8% 10.2% 5. Interpret the Ratios A high profit margin indicates that the company is controlling its expenses. This is because revenues minus expenses equals net income, if the ratio of net income to revenue is high, the company is not only generating revenue but also minimizing expenses. Both companies' profit margins indicate that the companies are able to control their expenses while increasing their revenues. Panera Bread's profit margin decreased by 1.1% over the two-year period, while Chipotle's increased by 0.6%. Fiscal year is October September. All values USD Millions. 2020 2019 2018 2017 2016 5-year trend Sales/Revenue 65,125 69,422 59,469 54,943 55,368 Sales Growth -6.19% 16.74% 8.24% -0.77 Cost of Goods Sold (COGS) incl. D&A 49,179 46,163 35,695 32,958 32.355 COGS excluding D&A 43,834 41.996 32,684 30,176 29,828 Depreciation & Amortization Expense 5,345 4,167 3,011 2,782 2,527 Depreciation 3,140 2,844 2,758 2,586 2,320 Amortization of Intangibles 2.205 1.323 253 196 207 COGS Growth 6.53% 29.33% 8.30% 1.86% Gross Income 15.946 23,259 23,774 21,985 23,013 Gross Income Growth -31.44% -2.17% 8.14% -4.47% Gross Profit Margin 24.49% SG&A Expense 12,369 11,549 8,860 8,176 8,754 Other SG&A 12,369 11,549 8,860 8,176 8,754 SGA Growth 7.10% 30.35% 8.37% -6.60% EBIT 3,577 14,914 13,809 14,259 Unusual Expense 4,808 (3,081) 82 230 323 Non Operating Income/Expense 328 213 597 314 381 Non-Operating Interest Income 156 268 108 115 71 Equity in Affiliates (Pretax) 651 (103) (102) 320 926 Interest Expense 1,647 1,246 706 540 446 Interest Expense Growth 32.18% 76.49% 30.74% 21.08% Gross Interest Expense 1,804 1,468 831 627 585 Interest Capitalized 157 222 125 87 139 Pretax Income (1,743) 13,923 14,729 13,788 14,868 Pretax Income Growth -112.52% -5.47% 6.82% -7.26% Pretax Margin -2.68% Income Tax 699 3,026 1,663 4,422 5,078 Income Tax - Current Domestic 243 126 2,602 3.589 3,300 Income Tax - Current Foreign 731 824 642 489 533 Income Tax-Deferred Domestic 250 2,088 (1.597) 375 1,272 Income Tax-Deferred Foreign (525) (12) 16 (31) (27) Consolidated Net Income (2,442) 10,897 13,066 9,366 9,790 Minority Interest Expense 390 472 468 386 399 Net Income (2,832) 10,425 12.598 8,980 9,391 Net Income Growth -127.17% -17.25% 40.29% -4.38% Net Margin -4.35% Extraordinaries & Discontinued Operations (32) 629 Discontinued Operations (32) 629 Net Income After Extraordinaries (2,800) 9,796 12,598 8,980 9,391 Net Income Available to Common (2,864) 11,054 12.598 8,980 9,391 EPS (Basic) (1.58) 6.64 8.36 5.69 5.73 EPS (Basic) Growth -123.87% -20.63% 46.92% -0.70% Basic Shares Outstanding 1,808 1,656 1,499 1,568 1,629 EPS (Diluted) (1.58) 6.64 8.36 5.69 5.73 EPS (Diluted) Growth -123.87% -20.63% 46.90% -0.68% Diluted Shares Outstanding 1,808 1,666 1,507 1,578 1,639 EBITDA 8,922 15,877 17,925 16,591 16,786 EBITDA Growth -43.81% - 11.43% 8.04% -1.16% EBITDA Margin 13.70% EBIT 3,577 14,914 13,809 14,259 A. The Ratio Analysis Model 1. Formulate the Question How profitable is Panera Bread? 2. Gather the Information from the Financial Statements The profit margin is a measure of a company's profitability. To calculate the ratio, it is essential to know a company's: Net income: From the income statement Net sales or revenues: From the income statement 3. Calculate the Ratio Profit Margin = Net Income Net Sales or Revenues Panera Bread Partial Income Statement (in thousands of dollars) For the Year Ended December 30, 2014 Net income Revenues 179.293 $2,529,195 $ 179,293 Profit Margin- $2,529,195 - 7.1% 4. Compare the Ratio with Other Ratios Ratios are of no use in a vacuum. It is necessary to compare them with prior years and with competitors. PROFIT MARGIN Panera Bread Chipotle December 30, December 31, December 31, December 31, 2014 2013 2014 2013 7.1% 8.2% 10.8% 10.2% 5. Interpret the Ratios A high profit margin indicates that the company is controlling its expenses. This is because revenues minus expenses equals net income, if the ratio of net income to revenue is high, the company is not only generating revenue but also minimizing expenses. Both companies' profit margins indicate that the companies are able to control their expenses while increasing their revenues. Panera Bread's profit margin decreased by 1.1% over the two-year period, while Chipotle's increased by 0.6%