Answered step by step
Verified Expert Solution
Question
1 Approved Answer
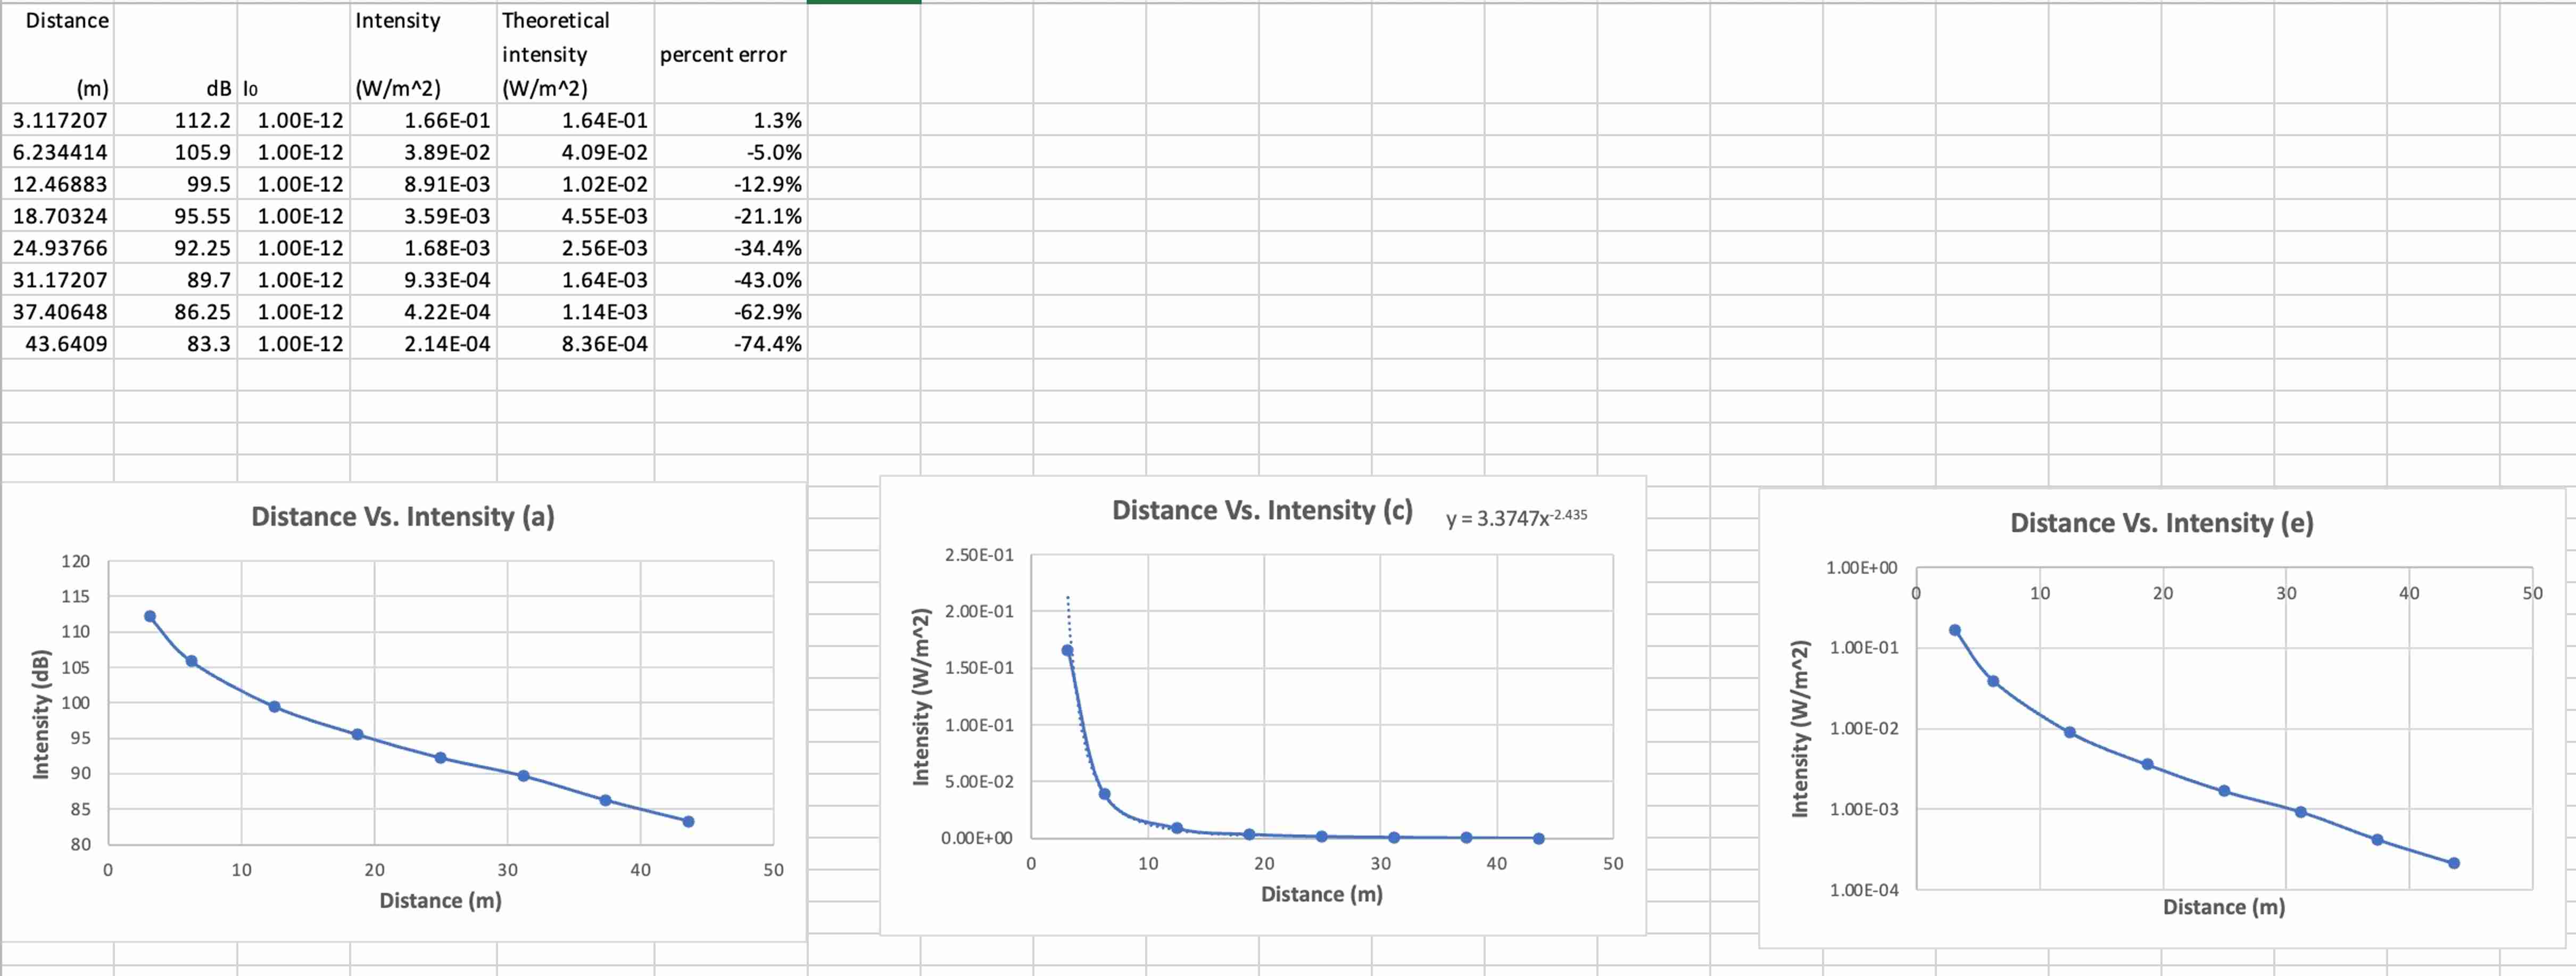
1 : Does the plot from ( a ) ?and plot from ( e ) ?look similar? What is the reason? Question 2 : Most
: Does the plot from a ?and plot from e ?look similar? What is the reason?
Question : Most of the errors are negative, which indicates the measured intensity is less than the theoretical intensity, discuss the possible reason about this.
Question : The error becomes larger when the distance is increased, discuss the possible reasons about this.nictanca Vc Intencitv a

Intensity (dB) Distance Intensity Theoretical intensity percent error (m) dB lo (W/m^2) (W/m^2) 3.117207 6.234414 12.46883 112.2 1.00E-12 105.9 1.00E-12 1.66E-01 1.64E-01 1.3% 3.89E-02 4.09E-02 -5.0% 99.5 1.00E-12 8.91E-03 1.02E-02 -12.9% 18.70324 95.55 1.00E-12 3.59E-03 4.55E-03 -21.1% 24.93766 92.25 1.00E-12 1.68E-03 2.56E-03 -34.4% 31.17207 37.40648 43.6409 89.7 1.00E-12 86.25 1.00E-12 83.3 1.00E-12 9.33E-04 1.64E-03 -43.0% 4.22E-04 1.14E-03 -62.9% 2.14E-04 8.36E-04 -74.4% 120 115 110 105 100 95 90 85 5 8 18 Distance Vs. Intensity (a) 80 0 10 20 Distance (m) 30 40 40 Intensity (W/m^2) Distance Vs. Intensity (c) y=3.3747x-2.435 2.50E-01 2.00E-01 1.50E-01 1.00E-01 5.00E-02 0.00E+00 50 0 10 10 20 30 40 Distance (m) 50 50 Intensity (W/m^2) Distance Vs. Intensity (e) 1.00E+00 10 20 1.00E-01 1.00E-02 1.00E-03 1.00E-04 Distance (m) 30 30 40 50
Step by Step Solution
There are 3 Steps involved in it
Step: 1

Get Instant Access to Expert-Tailored Solutions
See step-by-step solutions with expert insights and AI powered tools for academic success
Step: 2

Step: 3

Ace Your Homework with AI
Get the answers you need in no time with our AI-driven, step-by-step assistance
Get Started


