Question
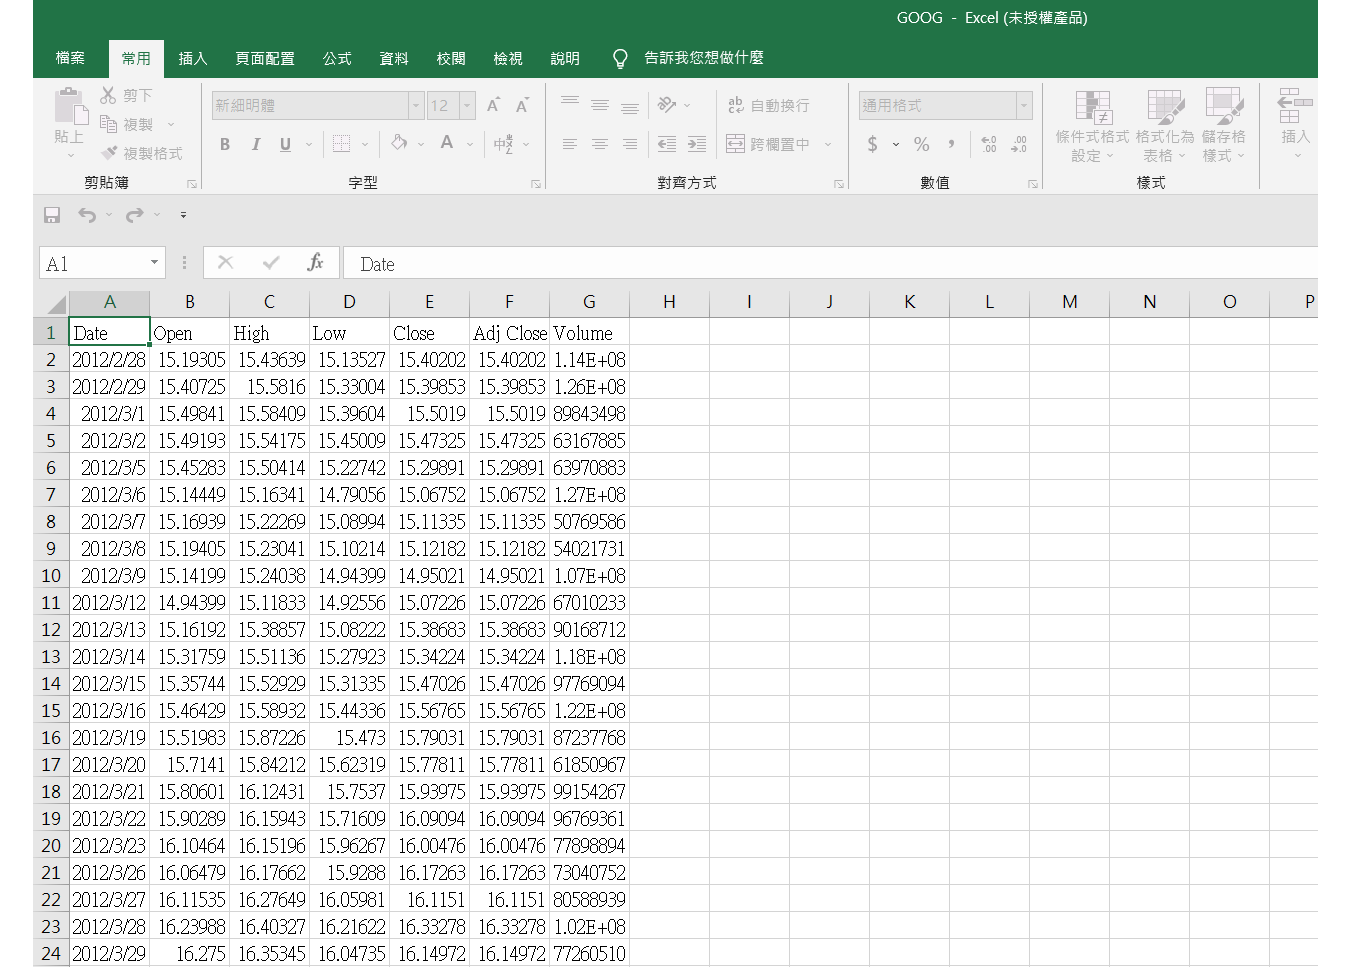
1 Download the csv file GOOG.csv and read the historical data of google (GOOG) from ummoodle website. Plot the time series of close price. 2
1 Download the csv file "GOOG.csv" and read the historical data of google (GOOG) from ummoodle website. Plot the time series of close price.
2 Compute daily log returns and plot the histogram.
3 Compute the sample mean and standard deviation of the log returns.Superimpose the pdf a normal distribution with the same mean and standard deviation as GOOG's log return to the histogram in 2.
4 Suppose that we invest 1000 US dollar in GOOL on 2023 Feb 28 and hold the stocks for 5 days. Use Simulation method from Lect 8 to compute dollar value of VaR.
GOOG.csv

Step by Step Solution
There are 3 Steps involved in it
Step: 1

Get Instant Access to Expert-Tailored Solutions
See step-by-step solutions with expert insights and AI powered tools for academic success
Step: 2

Step: 3

Ace Your Homework with AI
Get the answers you need in no time with our AI-driven, step-by-step assistance
Get Started


