Answered step by step
Verified Expert Solution
Question
1 Approved Answer
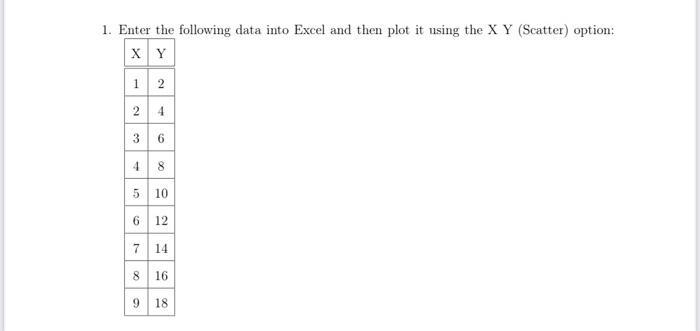
1. Enter the following data into Excel and then plot it using the X Y (Scatter) option: X Y 12 24 36 48 5


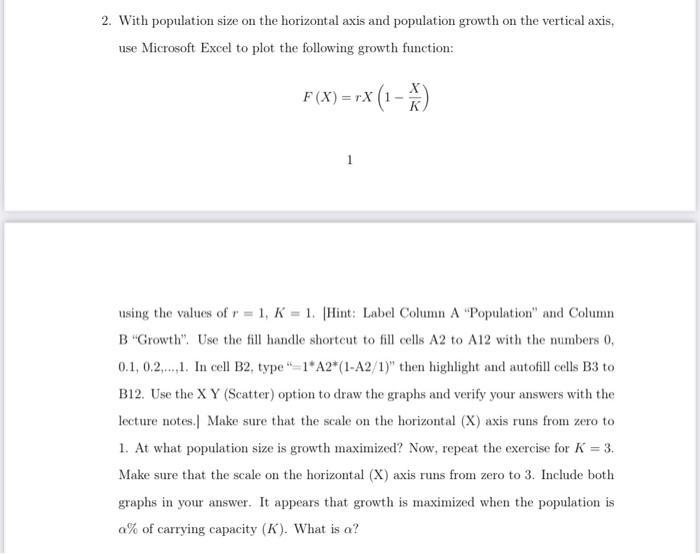
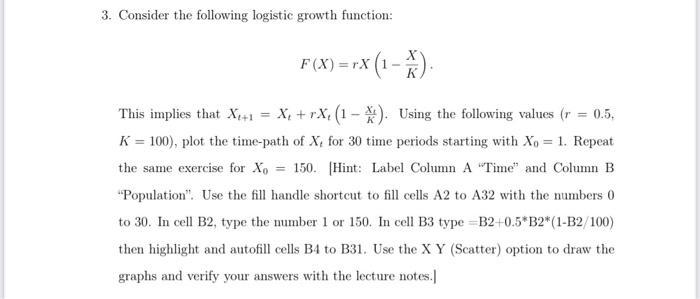
1. Enter the following data into Excel and then plot it using the X Y (Scatter) option: X Y 12 24 36 48 5 10 6 12 7 14 8 16 9 18 2. With population size on the horizontal axis and population growth on the vertical axis, use Microsoft Excel to plot the following growth function: F(X)=rX (1-x) using the values of r = 1, K= 1. (Hint: Label Column A "Population" and Column B "Growth". Use the fill handle shortcut to fill cells A2 to A12 with the numbers 0. 0.1, 0.2,...,1. In cell B2, type "1*A2*(1-A2/1)" then highlight and autofill cells B3 to B12. Use the X Y (Scatter) option to draw the graphs and verify your answers with the lecture notes. Make sure that the scale on the horizontal (X) axis runs from zero to 1. At what population size is growth maximized? Now, repeat the exercise for K = 3. Make sure that the scale on the horizontal (X) axis runs from zero to 3. Include both graphs in your answer. It appears that growth is maximized when the population is a% of carrying capacity (K). What is a? 3. Consider the following logistic growth function: F(X)=rX (1-X). = 0.5. This implies that X+1 = X + X (1-X). Using the following values (r K = 100), plot the time-path of X, for 30 time periods starting with Xo = 1. Repeat the same exercise for Xo = 150. [Hint: Label Column A "Time" and Column B "Population". Use the fill handle shortcut to fill cells A2 to A32 with the numbers 0 to 30. In cell B2, type the number 1 or 150. In cell B3 type=B2+0.5*B2*(1-B2/100) then highlight and autofill cells B4 to B31. Use the X Y (Scatter) option to draw the graphs and verify your answers with the lecture notes.]
Step by Step Solution
★★★★★
3.50 Rating (153 Votes )
There are 3 Steps involved in it
Step: 1
QUESTION 1 QUESTION 2 Growth is maximized at population size 05 ...
Get Instant Access to Expert-Tailored Solutions
See step-by-step solutions with expert insights and AI powered tools for academic success
Step: 2

Step: 3

Ace Your Homework with AI
Get the answers you need in no time with our AI-driven, step-by-step assistance
Get Started


