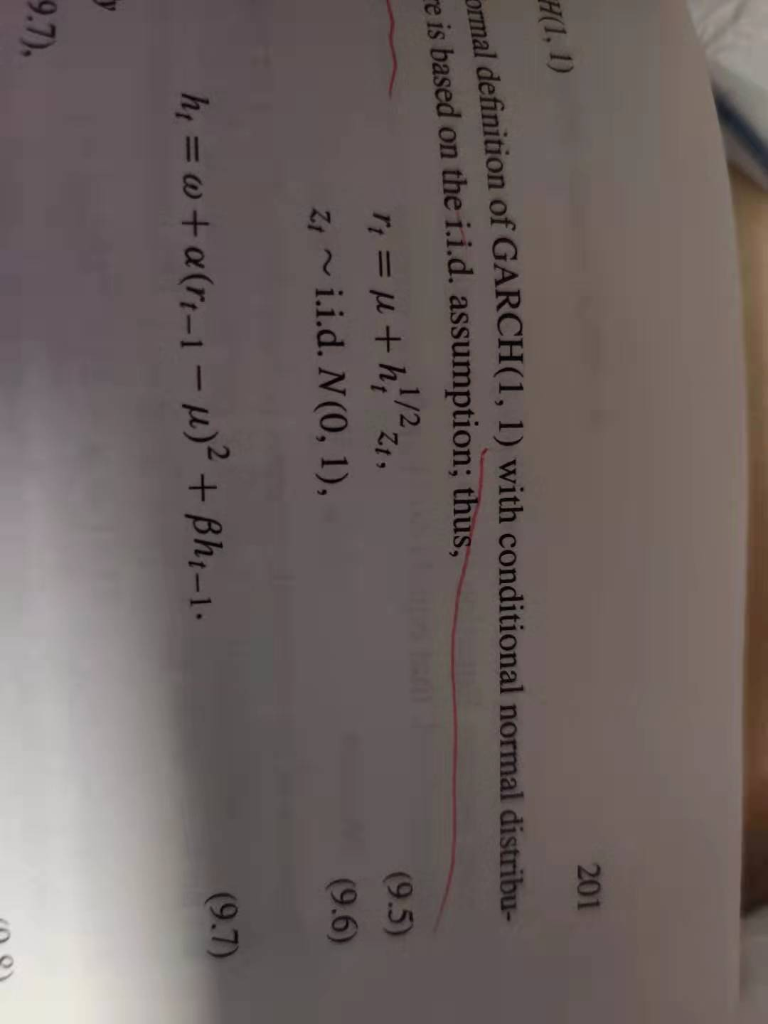
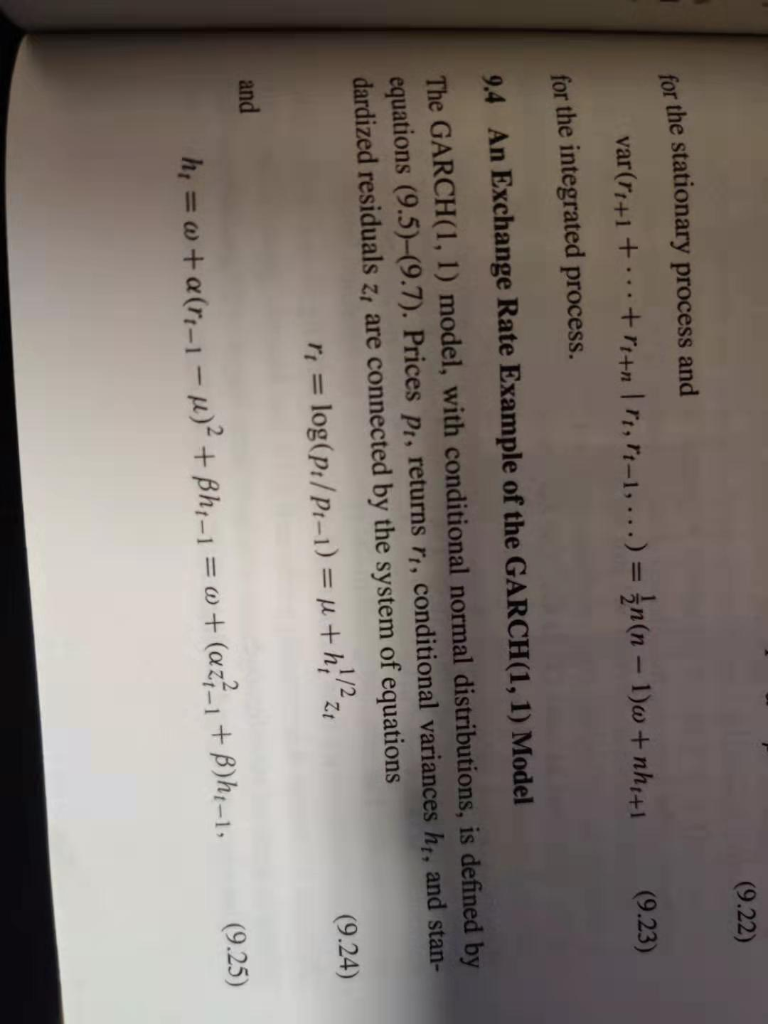
1. Estimate the parameters of the GARCH(1,1) model, with conditional normal distributions, as illustrated in Section 9.4. Find the maximum likelihood estimates of the parameters u,a,,w. Estimate the GJR(1,1) model of Section 9.7. Assume the conditional mean is a constant value u and that the conditional distributions are normal. Find the maximum likelihood estimates of the parameters u,a,a ,,0. - 3. Plot two time series of annualized conditional volatility values, derived from the daily conditional variances, first for the GARCH model and second for the GJR model. Are there often important differences between the two volatility values? 201 mal definition of GARCH(1, 1) with conditional normal distribu- me is based on the i.i.d. assumption; thus, r=uth. 21 (9.5) zi~i.i.d. N(0,1), (9.6) (9.7) h= w+a(rt-1 u)' + Bht-1. 19.7), (9.22) for the stationary process and var("4+1 + ... +re+n 1,7-1,...) = n(n 1)w +nhe+1 for the integrated process. (9.23) 9.4 An Exchange Rate Example of the GARCH(1,1) Model The GARCH(1, 1) model, with conditional normal distributions, is defined by equations (9.5)-(9.7). Prices Pt, returns rt, conditional variances ht, and stan- dardized residuals z, are connected by the system of equations ri = log(p:/P1-1) = " +h; z1 (9.24) and (9.25) h = w+ a(r-1 - u)? + Bhi-1 = 0 + (az?-1 + B)ht-1, 1. Estimate the parameters of the GARCH(1,1) model, with conditional normal distributions, as illustrated in Section 9.4. Find the maximum likelihood estimates of the parameters u,a,,w. Estimate the GJR(1,1) model of Section 9.7. Assume the conditional mean is a constant value u and that the conditional distributions are normal. Find the maximum likelihood estimates of the parameters u,a,a ,,0. - 3. Plot two time series of annualized conditional volatility values, derived from the daily conditional variances, first for the GARCH model and second for the GJR model. Are there often important differences between the two volatility values? 201 mal definition of GARCH(1, 1) with conditional normal distribu- me is based on the i.i.d. assumption; thus, r=uth. 21 (9.5) zi~i.i.d. N(0,1), (9.6) (9.7) h= w+a(rt-1 u)' + Bht-1. 19.7), (9.22) for the stationary process and var("4+1 + ... +re+n 1,7-1,...) = n(n 1)w +nhe+1 for the integrated process. (9.23) 9.4 An Exchange Rate Example of the GARCH(1,1) Model The GARCH(1, 1) model, with conditional normal distributions, is defined by equations (9.5)-(9.7). Prices Pt, returns rt, conditional variances ht, and stan- dardized residuals z, are connected by the system of equations ri = log(p:/P1-1) = " +h; z1 (9.24) and (9.25) h = w+ a(r-1 - u)? + Bhi-1 = 0 + (az?-1 + B)ht-1