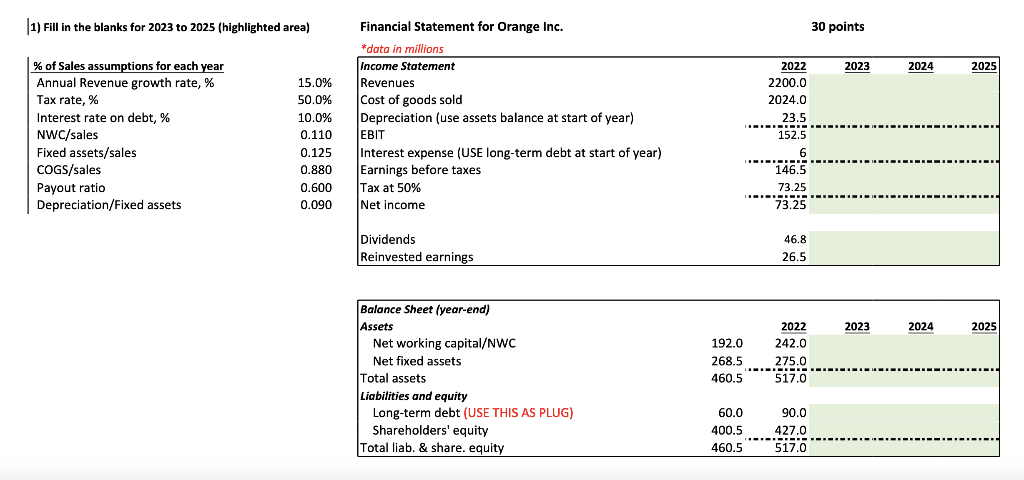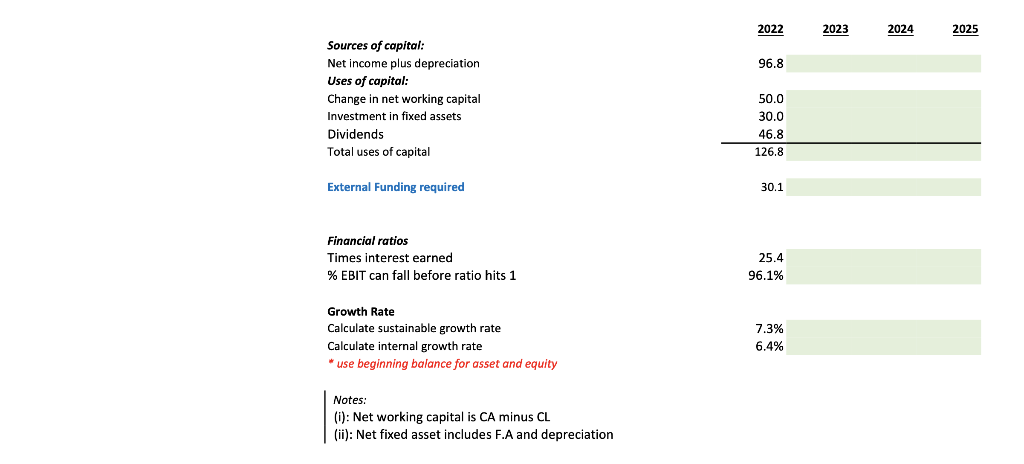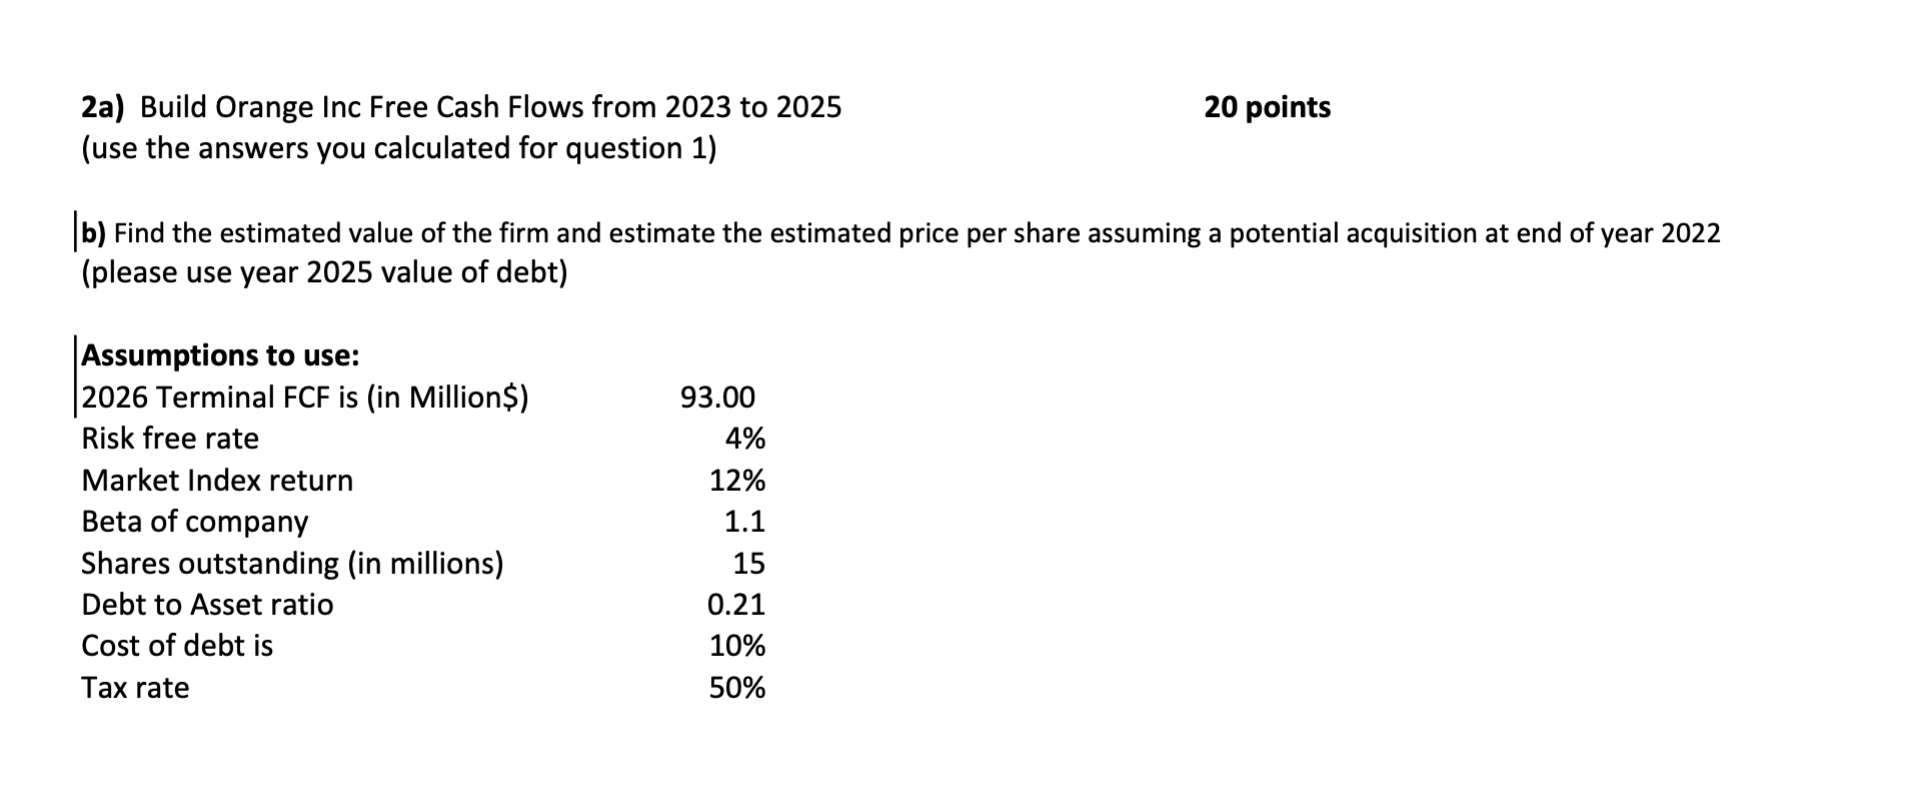


1) Fill in the blanks for 2023 to 2025 (highlighted area) 30 points 2023 2024 2025 % of Sales assumptions for each year Annual Revenue growth rate, % Tax rate, % Interest rate on debt, % NWC/sales Fixed assets/sales COGS/sales Payout ratio Depreciation/Fixed assets 15.0% 50.0% 10.0% 0.110 0.125 0.880 0.600 0.090 Financial Statement for Orange Inc. * *data in millions Income Statement Revenues Cost of goods sold Depreciation (use assets balance at start of year) |EBIT Interest expense (USE long-term debt at start of year) Earnings before taxes Tax at 50% Net income 2022 2200.0 2024.0 23.5 II-1-1-1-1- 152.5 6 146.5 73.25 TE 73.25 Dividends Reinvested earnings 46.8 26.5 2023 2024 2025 Balance Sheet (year-end) Assets Net working capital/NWC Net fixed assets Total assets Liabilities and equity Long-term debt (USE THIS AS PLUG) Shareholders' equity Total liab. & share. equity 192.0 268.5 460.5 2022 242.0 275.0 517.0 60.0 400.5 460.5 90.0 427.0 517.0 2022 2023 2024 2025 96.8 Sources of capital: Net income plus depreciation Uses of capital: Change in net working capital Investment in fixed assets Dividends Total uses of capital 50.0 30.0 46.8 126.8 External Funding required 30.1 Financial ratios Times interest earned % EBIT can fall before ratio hits 1 25.4 96.1% Growth Rate Calculate sustainable growth rate Calculate internal growth rate * use beginning balance asset and equity 7.3% 6.4% Notes: (i): Net working capital is CA minus CL (ii): Net fixed asset includes F.A and depreciation 20 points 2a) Build Orange Inc Free Cash Flows from 2023 to 2025 (use the answers you calculated for question 1) |b) Find the estimated value of the firm and estimate the estimated price per share assuming a potential acquisition at end of year 2022 (please use year 2025 value of debt) Assumptions to use: |2026 Terminal FCF is (in Millions) Risk free rate Market Index return Beta of company Shares outstanding (in millions) Debt to Asset ratio Cost of debt is Tax rate 93.00 4% 12% 1.1 15 0.21 10% 50% 1) Fill in the blanks for 2023 to 2025 (highlighted area) 30 points 2023 2024 2025 % of Sales assumptions for each year Annual Revenue growth rate, % Tax rate, % Interest rate on debt, % NWC/sales Fixed assets/sales COGS/sales Payout ratio Depreciation/Fixed assets 15.0% 50.0% 10.0% 0.110 0.125 0.880 0.600 0.090 Financial Statement for Orange Inc. * *data in millions Income Statement Revenues Cost of goods sold Depreciation (use assets balance at start of year) |EBIT Interest expense (USE long-term debt at start of year) Earnings before taxes Tax at 50% Net income 2022 2200.0 2024.0 23.5 II-1-1-1-1- 152.5 6 146.5 73.25 TE 73.25 Dividends Reinvested earnings 46.8 26.5 2023 2024 2025 Balance Sheet (year-end) Assets Net working capital/NWC Net fixed assets Total assets Liabilities and equity Long-term debt (USE THIS AS PLUG) Shareholders' equity Total liab. & share. equity 192.0 268.5 460.5 2022 242.0 275.0 517.0 60.0 400.5 460.5 90.0 427.0 517.0 2022 2023 2024 2025 96.8 Sources of capital: Net income plus depreciation Uses of capital: Change in net working capital Investment in fixed assets Dividends Total uses of capital 50.0 30.0 46.8 126.8 External Funding required 30.1 Financial ratios Times interest earned % EBIT can fall before ratio hits 1 25.4 96.1% Growth Rate Calculate sustainable growth rate Calculate internal growth rate * use beginning balance asset and equity 7.3% 6.4% Notes: (i): Net working capital is CA minus CL (ii): Net fixed asset includes F.A and depreciation 20 points 2a) Build Orange Inc Free Cash Flows from 2023 to 2025 (use the answers you calculated for question 1) |b) Find the estimated value of the firm and estimate the estimated price per share assuming a potential acquisition at end of year 2022 (please use year 2025 value of debt) Assumptions to use: |2026 Terminal FCF is (in Millions) Risk free rate Market Index return Beta of company Shares outstanding (in millions) Debt to Asset ratio Cost of debt is Tax rate 93.00 4% 12% 1.1 15 0.21 10% 50%


