

Question
1) Find the following F distribution values fromthe F distribution table. (Round your answers to two decimal places.) (a) F 0.05 with degrees of freedom4and10
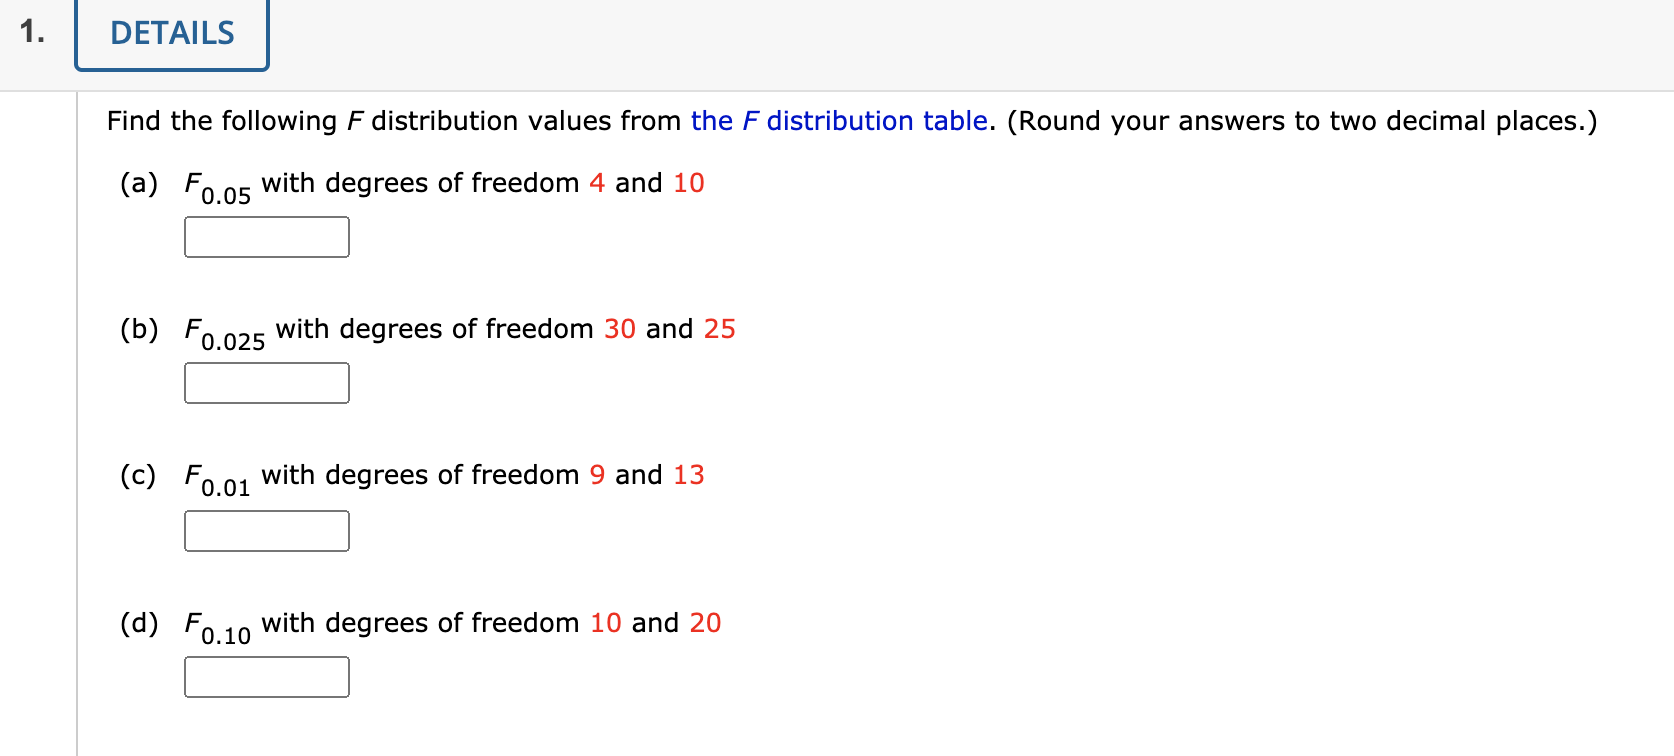
1) Find the followingFdistribution values fromtheFdistribution table. (Round your answers to two decimal places.)
(a) F0.05
with degrees of freedom4and10
(b) F0.025
with degrees of freedom30and25
(c) F0.01
with degrees of freedom9and13
(d) F0.10
with degrees of freedom10and20
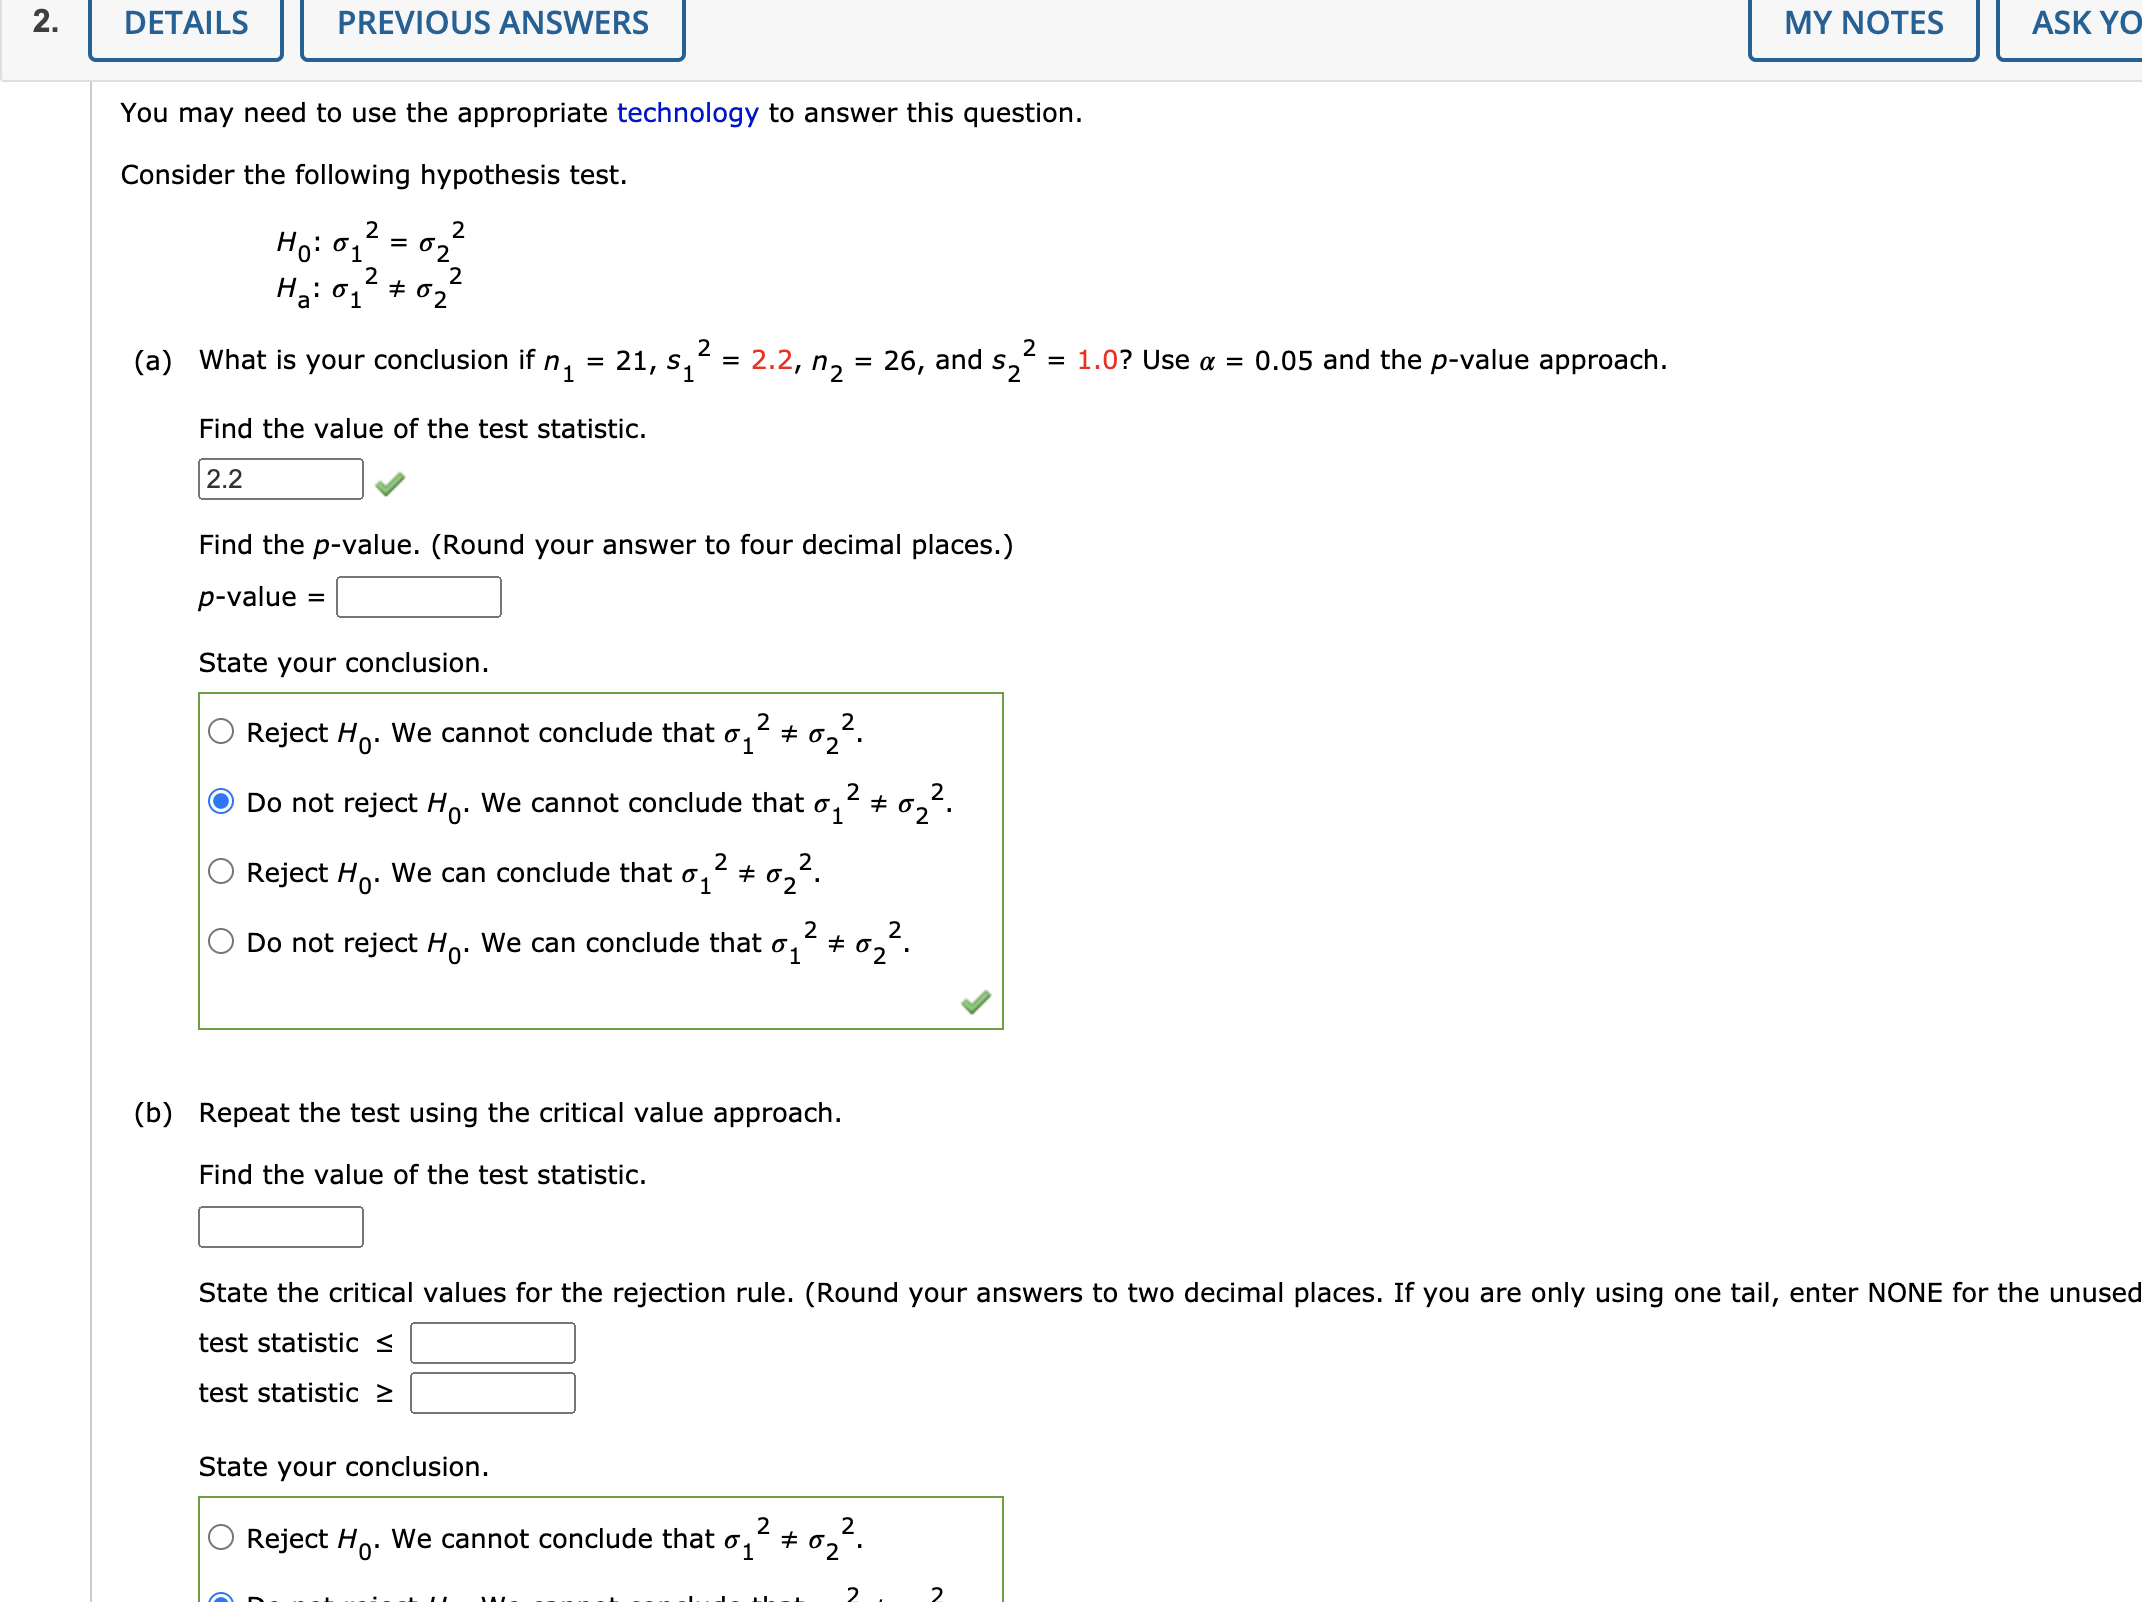
2)You may need to use the appropriatetechnologyto answer this question.
Consider the following hypothesis test.
H0:12=22
Ha:1222
(a)
What is your conclusion ifn1= 21,
s12=2.2,
n2= 26,
ands22=1.0?
Use= 0.05
and thep-valueapproach.
Find the value of the test statistic.
Find thep-value. (Round your answer to four decimal places.)
p-value =
State your conclusion.
RejectH0. We cannot conclude that1222.
Do not rejectH0. We cannot conclude that1222.
RejectH0. We can conclude that1222.
Do not rejectH0. We can conclude that1222.
(b)
Repeat the test using the critical value approach.
Find the value of the test statistic.
State the critical values for the rejection rule. (Round your answers to two decimal places. If you are only using one tail, enter NONE for the unused tail.)
test statistictest statistic
State your conclusion.
RejectH0. We cannot conclude that1222.
Do not rejectH0. We cannot conclude that1222.
RejectH0. We can conclude that1222.
Do not rejectH0. We can conclude t
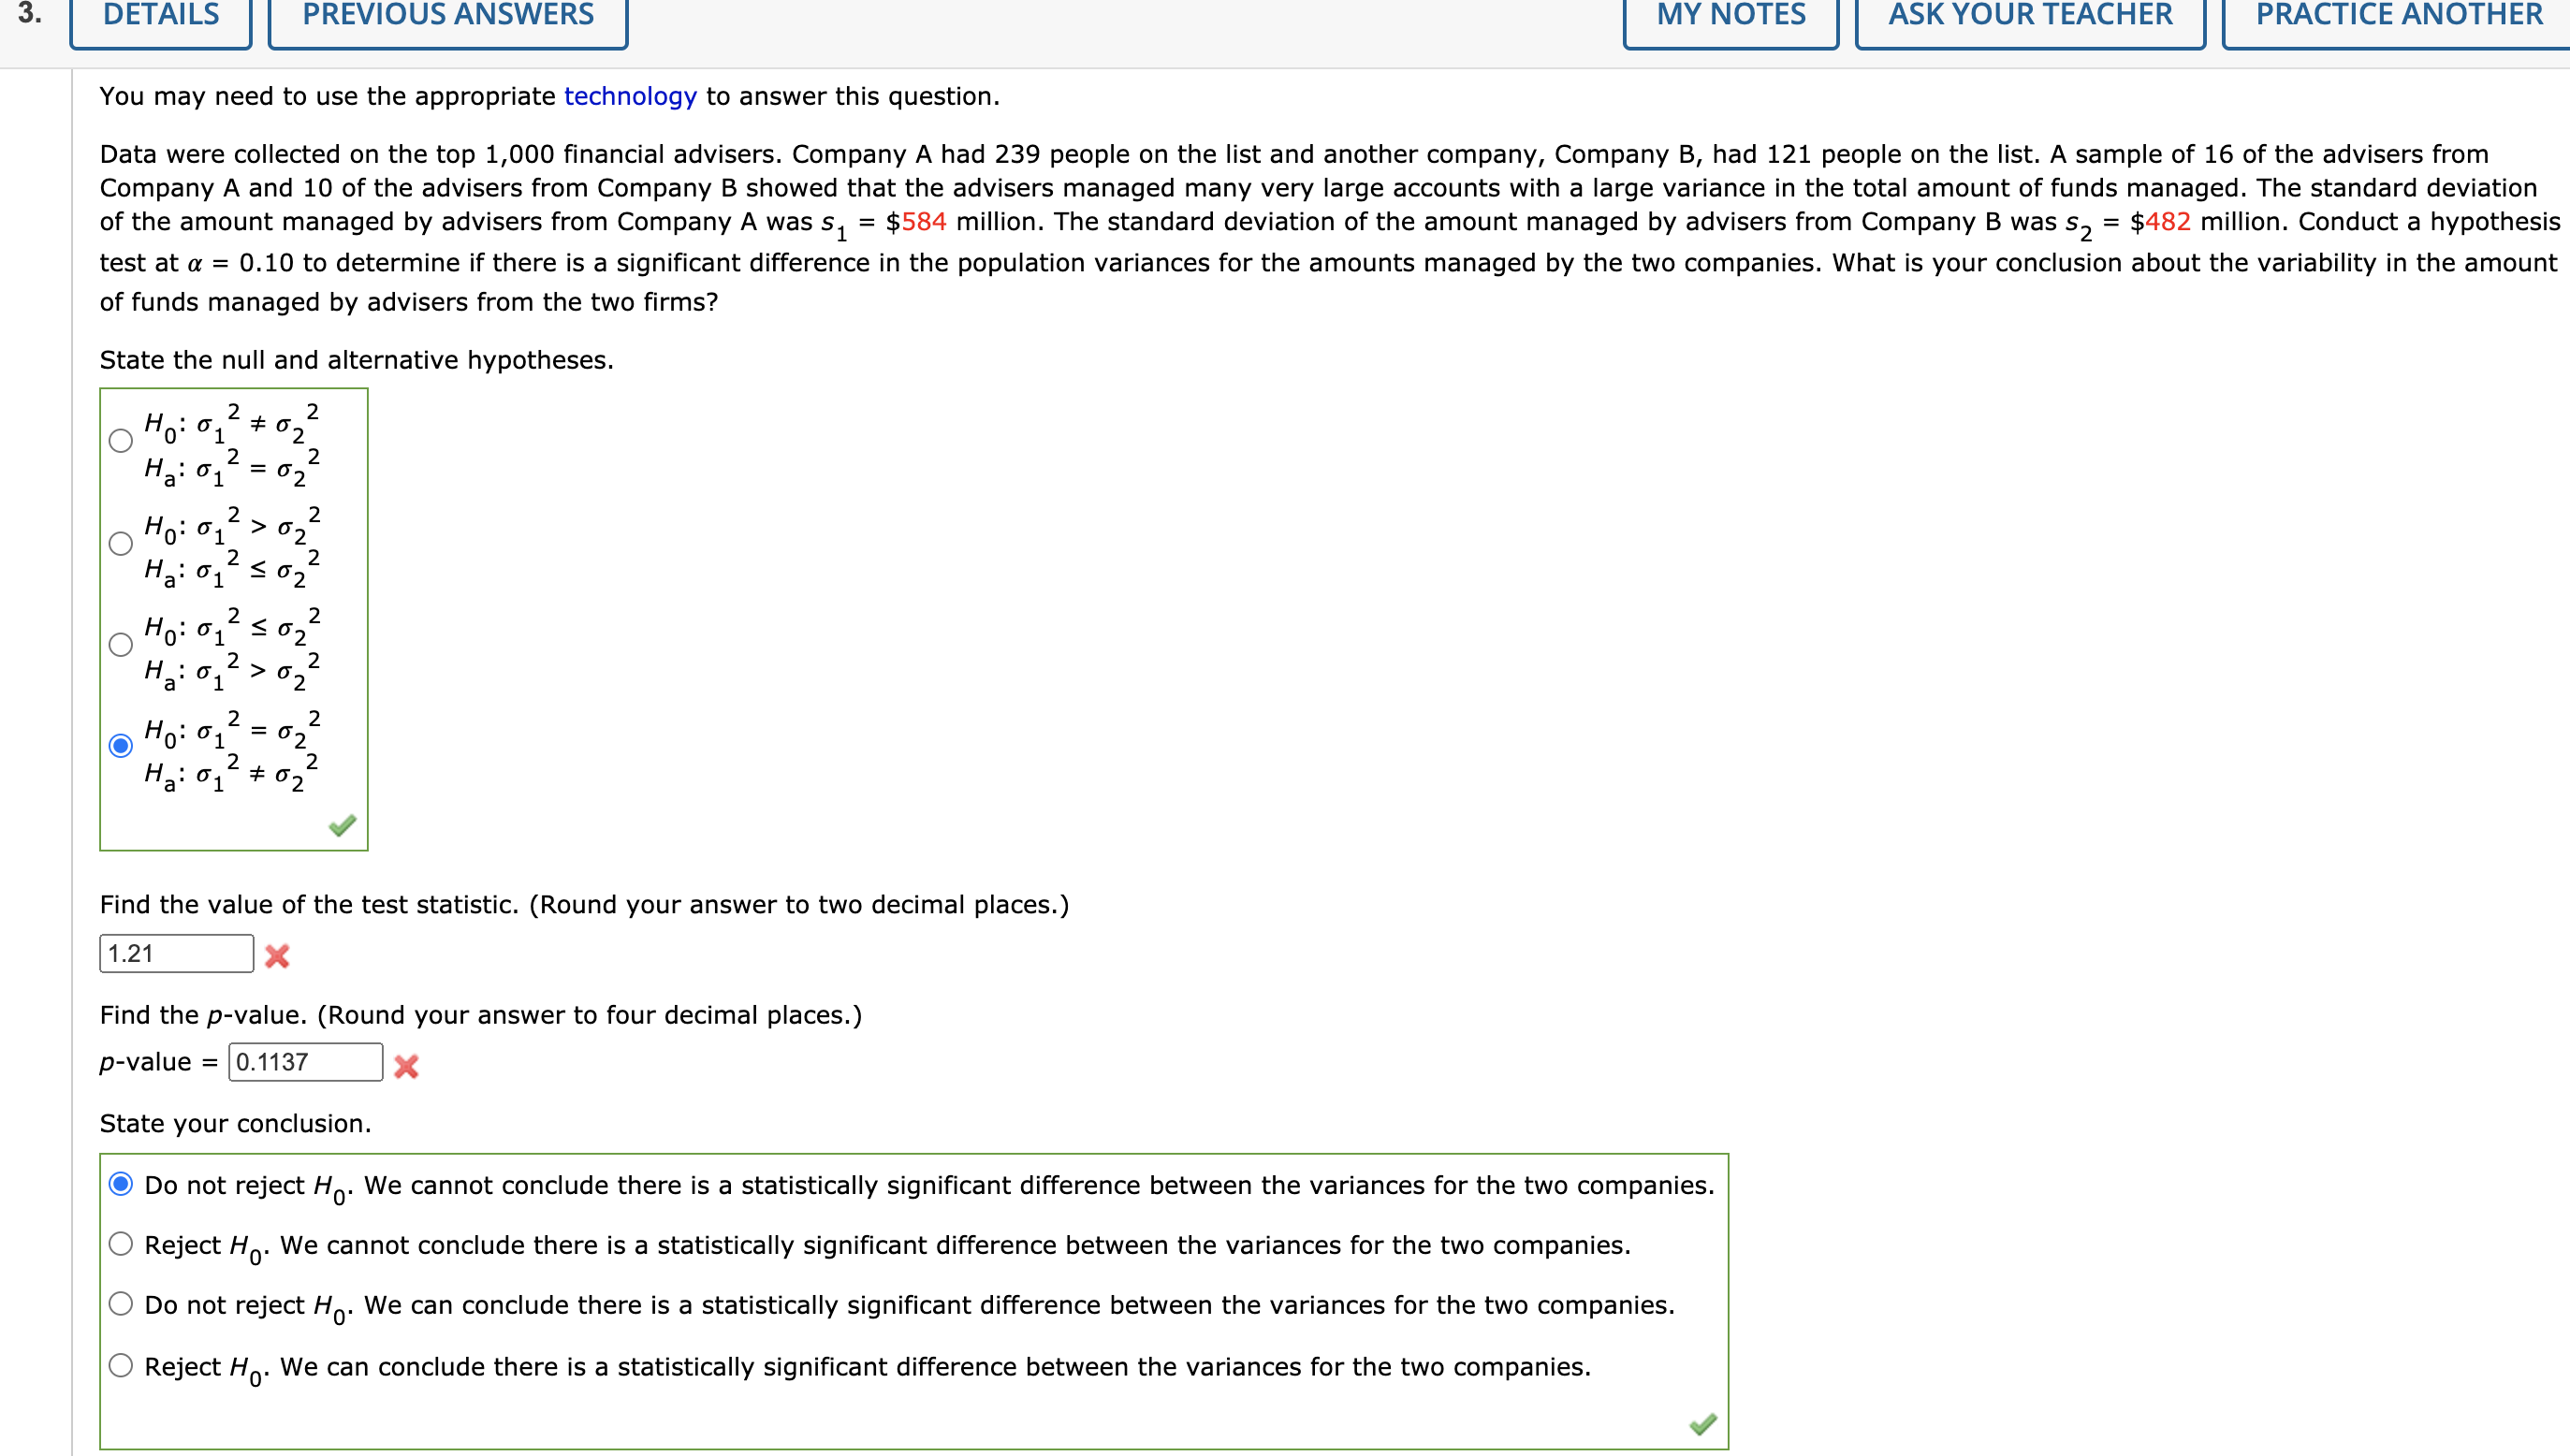
3)You may need to use the appropriatetechnologyto answer this question.
Data were collected on the top 1,000 financial advisers. Company A had 239 people on the list and another company, Company B, had121 peopleon the list. A sample of 16 of the advisers from Company A and 10 of the advisers from Company B showed that the advisers managed many very large accounts with a large variance in the total amount of funds managed. The standard deviation of the amount managed by advisers from Company A wass1= $584million.
The standard deviation of the amount managed by advisers from Company B wass2= $482million.
Conduct a hypothesis test at= 0.10
to determine if there is a significant difference in the population variances for the amounts managed by the two companies. What is your conclusion about the variability in the amount of funds managed by advisers from the two firms?
State the null and alternative hypotheses.
H0:1222
Ha:12=22
H0:12>22
Ha:1222
H0:1222
Ha:12>22
H0:12=22
Ha:1222
Find the value of the test statistic. (Round your answer to two decimal places.)
Find thep-value. (Round your answer to four decimal places.)
p-value =
State your conclusion.
Do not rejectH0. We cannot conclude there is a statistically significant difference between the variances for the two companies.
RejectH0. We cannot conclude there is a statistically significant difference between the variances for the two companies.
Do not rejectH0. We can conclude there is a statistically significant difference between the variances for the two companies.
RejectH0. We can conclude there is a statistically significant difference between the variances for the two companies.
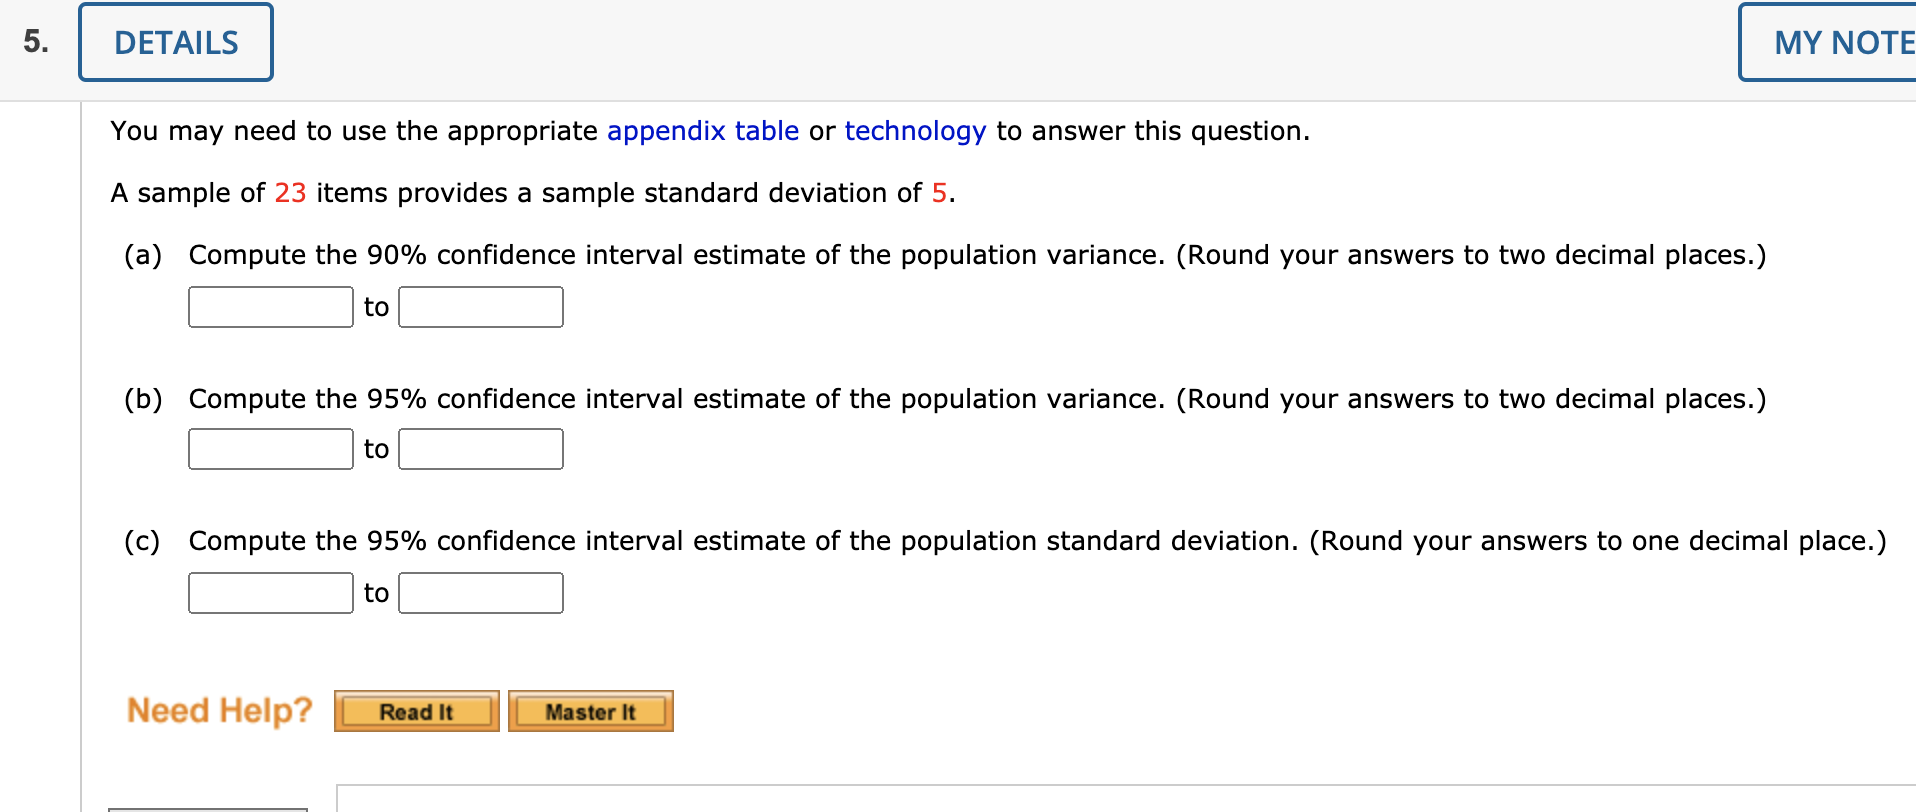
5) You may need to use the appropriateappendix tableortechnologyto answer this question.
A sample of23items provides a sample standard deviation of5.
(a) Compute the 90% confidence interval estimate of the population variance. (Round your answers to two decimal places.)
to
(b) Compute the 95% confidence interval estimate of the population variance. (Round your answers to two decimal places.)
to
(c) Compute the 95% confidence interval estimate of the population standard deviation. (Round your answers to one decimal place.)
to
Step by Step Solution
There are 3 Steps involved in it
Step: 1

Get Instant Access to Expert-Tailored Solutions
See step-by-step solutions with expert insights and AI powered tools for academic success
Step: 2

Step: 3
Ace Your Homework with AI
Get the answers you need in no time with our AI-driven, step-by-step assistance
Get Started
Elementary Algebra
Authors: Charles P McKeague
2nd Edition
1483263819, 9781483263816