1) Five data entry operators work at the data processing department of the Royal Bank. Each day for 30 days, the number of defective records
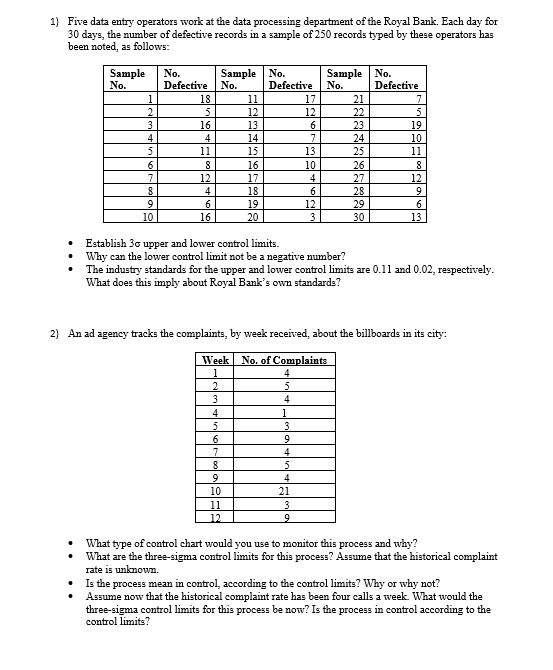
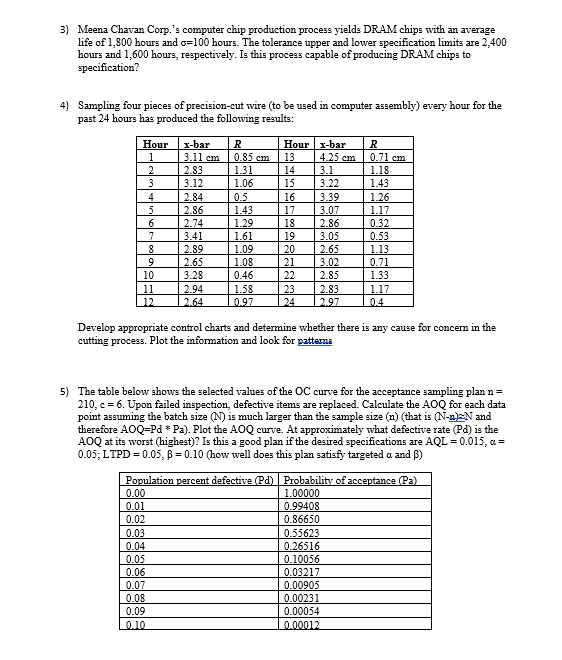
1) Five data entry operators work at the data processing department of the Royal Bank. Each day for 30 days, the number of defective records in a sample of 250 records typed by these operators has been noted, as follows: Sample No. Sample No. Sample No. No. Defective No. Defective No. Defective 18 11 17 21 5 12 12 22 16 13 6 23 19 4 14 7 24 10 11 15 13 25 11 6 8 16 10 26 8 12 17 4 27 12 4 18 6 28 9 6 19 12 29 61 10 16 20 3 30 13 Establish 3o upper and lower control limits. Why can the lower control limit not be a negative number? The industry standards for the upper and lower control limits are 0.11 and 0.02, respectively. What does this imply about Royal Bank's own standards? 2) An ad agency tracks the complaints, by week received, about the billboards in its city: Week| No. of Complaints 12 What type of control chart would you use to monitor this process and why? What are the three-sigma control limits for this process? Assume that the historical complaint rate is unknown. Is the process mean in control, according to the control limits? Why or why not? Assume now that the historical complaint rate has been four calls a week. What would the three-sigma control limits for this process be now? Is the process in control according to the control limits?3) Meena Chavan Corp.'s computer chip production process yields DRAM chips with an average life of 1,800 hours and =100 hours. The tolerance upper and lower specification limits are 2,400 hours and 1,600 hours, respectively. Is this process capable of producing DRAM chips to specification? 4) Sampling four pieces of precision-cut wire (to be used in computer assembly) every hour for the past 24 hours has produced the following results: Hour x-bar R Hour| x-bar R 3.11 cm 0.85 cm 1 13 4.25 cm 0.71 cm 2.83 1.31 14 3.1 1.18 3.12 1.06 15 3.22 1.43 2.84 0.5 16 3.39 1.26 2.86 1.43 17 3.07 1.17 2.74 1.29 18 2.86 0.32 3.41 1.61 19 3.05 0.53 2.89 1.09 20 2.65 1.13 2.65 1.08 21 3.02 0.7 3.28 0.46 22 2.85 1.33 11 2.94 1.58 23 2.83 1.17 12 2.64 1 0.97 24 2.97 104 Develop appropriate control charts and determine whether there is any cause for concern in the cutting process. Plot the information and look for patterns 5) The table below shows the selected values of the OC curve for the acceptance sampling plan n = 210, c = 6. Upon failed inspection, defective items are replaced. Calculate the AQQ for each data point assuming the batch size (N) is much larger than the sample size (n) (that is (N-n)=N and therefore AOQ=Pd * Pa). Plot the AOQ curve. At approximately what defective rate (Pd) is the AOQ at its worst (highest)? Is this a good plan if the desired specifications are AQL = 0.015, a = 0.05; LTPD = 0.05, p = 0.10 (how well does this plan satisfy targeted a and B) Population percent defective (Pd)|Probability of acceptance (Pa) 0.0 1.00000 0.01 0.99408 0.02 0.86650 0.0 0.55623 0.04 0.26516 0.05 0.10056 0.06 0.03217 0.07 0.00905 0.08 0.00231 0.09 0.00054 0.10 0.00012
Step by Step Solution
There are 3 Steps involved in it
Step: 1
Get Instant Access to Expert-Tailored Solutions
See step-by-step solutions with expert insights and AI powered tools for academic success
Step: 2
Step: 3
Ace Your Homework with AI
Get the answers you need in no time with our AI-driven, step-by-step assistance