Answered step by step
Verified Expert Solution
Question
1 Approved Answer
1. For 2020 and 2019 respectively, calculate net profit margin, interest expense ($), and interest coverage ratio. 2. Calculate for 2020 and 2019 respectively, the
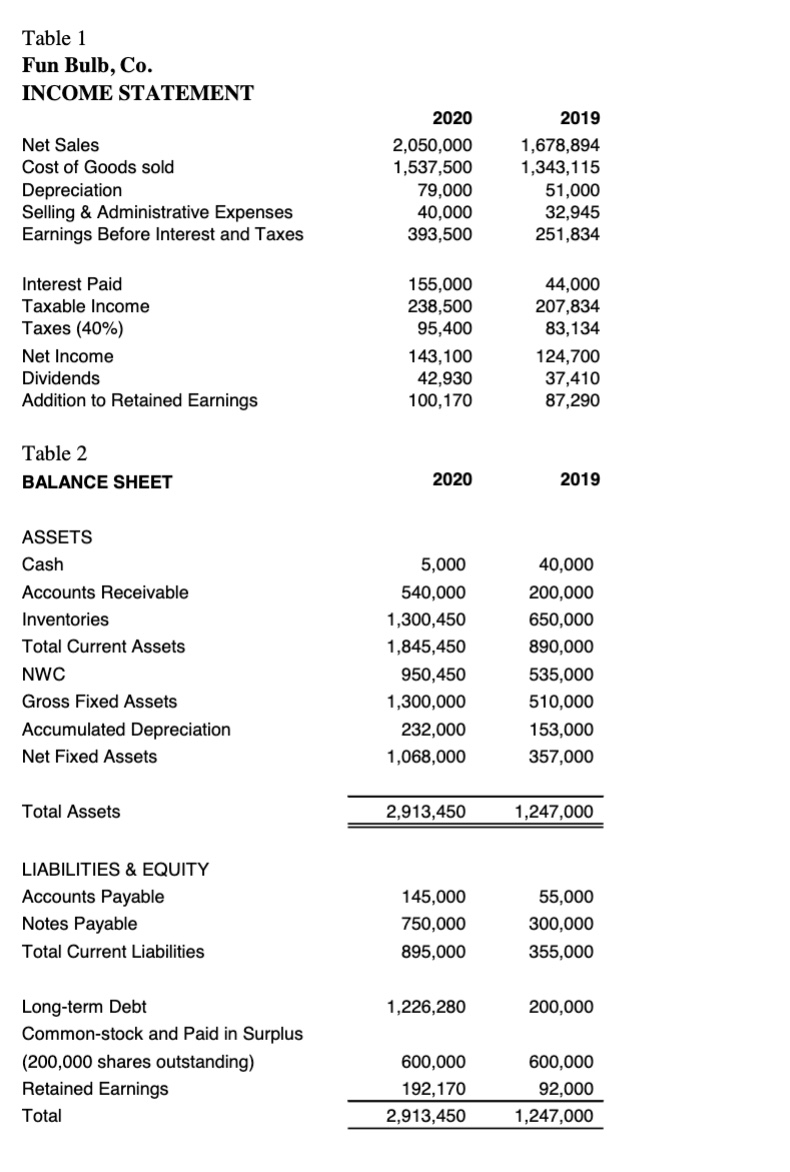
1. For 2020 and 2019 respectively, calculate net profit margin, interest expense ($), and interest coverage ratio. 2. Calculate for 2020 and 2019 respectively, the cash ratio, current ratio, quick ratio, NWC to TA, interval ratio (or BDI), and NWC ($). Also, find NWC in 2020 and 2019 in Table 2
 Table 1 Fun Bulb, Co. INCOME STATEMENT NetSalesCostofGoodssoldDepreciationSelling&AdministrativeExpensesEarningsBeforeInterestandTaxesInterestPaidTaxableIncomeTaxes(40%)NetIncomeDividendsAdditiontoRetainedEarnings20202,050,0001,537,50079,00040,000393,500155,000238,50095,400143,10042,930100,17020191,678,8941,343,11551,00032,945251,83444,000207,83483,134124,70037,41087,290 Table 2 BALANCE SHEET 2020 2019 ASSETS \begin{tabular}{lrr} Cash & 5,000 & 40,000 \\ Accounts Receivable & 540,000 & 200,000 \\ Inventories & 1,300,450 & 650,000 \\ Total Current Assets & 1,845,450 & 890,000 \\ NWC & 950,450 & 535,000 \\ Gross Fixed Assets & 1,300,000 & 510,000 \\ Accumulated Depreciation & 232,000 & 153,000 \\ Net Fixed Assets & 1,068,000 & 357,000 \\ Total Assets & & \\ \hline \end{tabular} LIABILITIES \& EQUITY Accounts Payable Notes Payable Total Current Liabilities Long-term Debt Common-stock and Paid in Surplus (200,000 shares outstanding) Retained Earnings Total 145,00055,000 750,000300,000 895,000355,000 1,226,280200,000 \begin{tabular}{rr} 600,000 & 600,000 \\ 192,170 & 92,000 \\ \hline 2,913,450 & 1,247,000 \\ \hline \end{tabular}
 Step by Step Solution
There are 3 Steps involved in it
Step: 1

Get Instant Access to Expert-Tailored Solutions
See step-by-step solutions with expert insights and AI powered tools for academic success
Step: 2

Step: 3

Ace Your Homework with AI
Get the answers you need in no time with our AI-driven, step-by-step assistance
Get Started


