Answered step by step
Verified Expert Solution
Link Copied!

Question

1 Approved Answer

1. For each of the following changes in the demand or supply curves in the tea market below, draw a graph showing the old demand
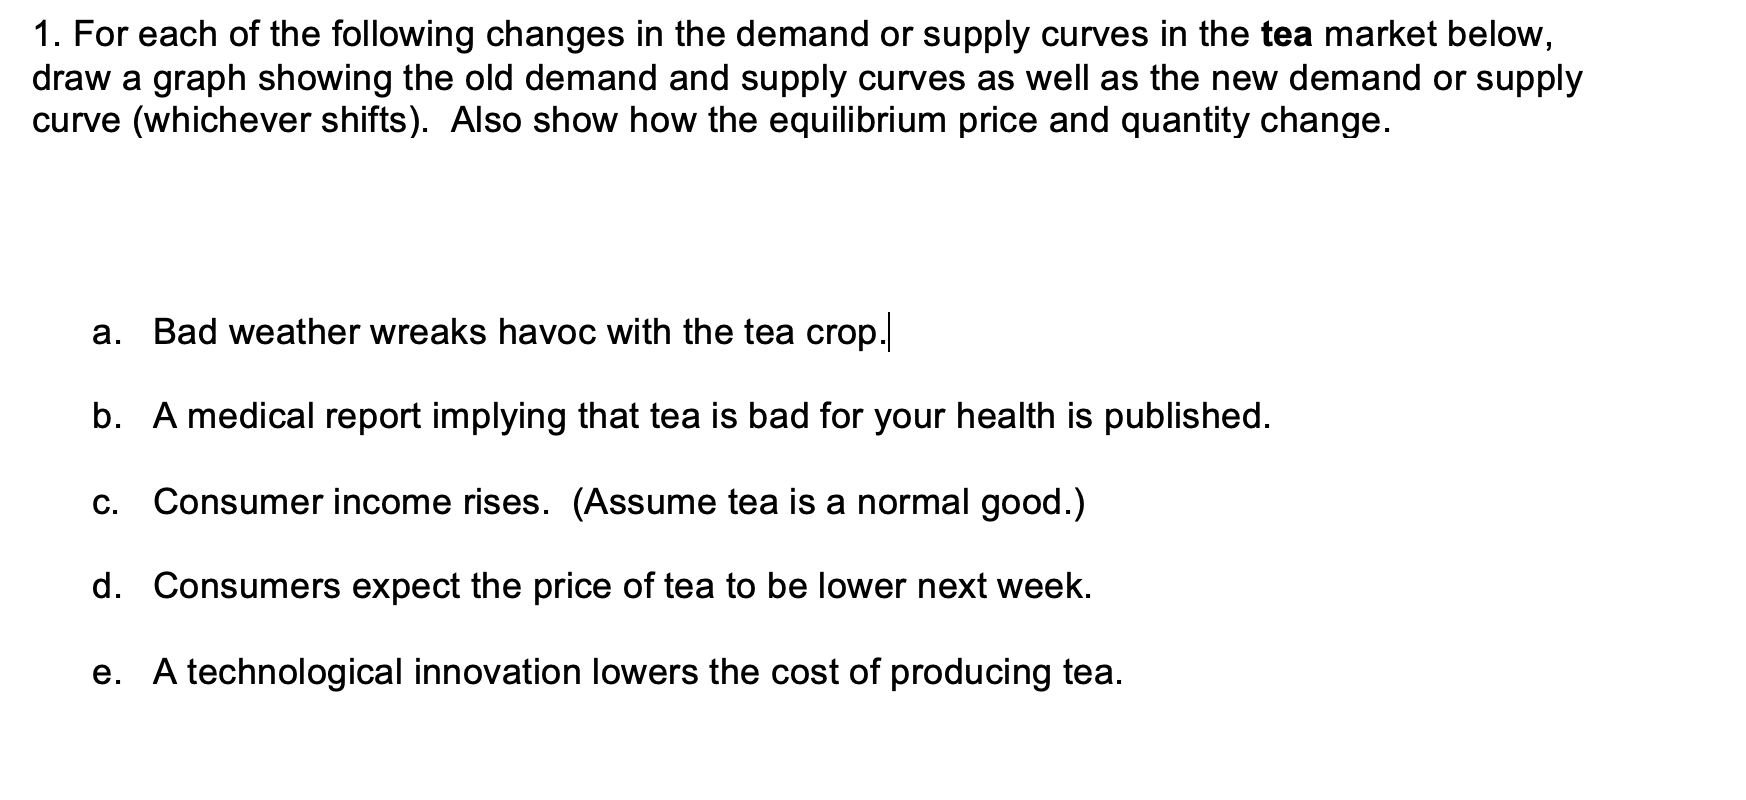
image text in transcribed
1. For each of the following changes in the demand or supply curves in the tea market below, draw a graph showing the old demand and supply curves as well as the new demand or supply curve (whichever shifts). Also show how the equilibrium price and quantity change. a. Bad weather wreaks havoc with the tea crop.| b. A medical report implying that tea is bad for your health is published. 0. Consumer income rises. (Assume tea is a normal good.) d. Consumers expect the price of tea to be lower next week. e. A technological innovation lowers the cost of producing tea

Step by Step Solution

There are 3 Steps involved in it

Step: 1

blur-text-image

Get Instant Access to Expert-Tailored Solutions

See step-by-step solutions with expert insights and AI powered tools for academic success

Step: 2

blur-text-image

Step: 3

blur-text-image

Ace Your Homework with AI

Get the answers you need in no time with our AI-driven, step-by-step assistance

Get Started

Recommended Textbook for

Advanced Placement Microeconomics

Authors: Bill Hurd

1st Edition

1531150306, 978-1531150303

More Books

Students also viewed these Economics questions