1. For the year ending 2015 calculate to two decimal points (e.g. 7.54 or -0.08) operating income to revenue.
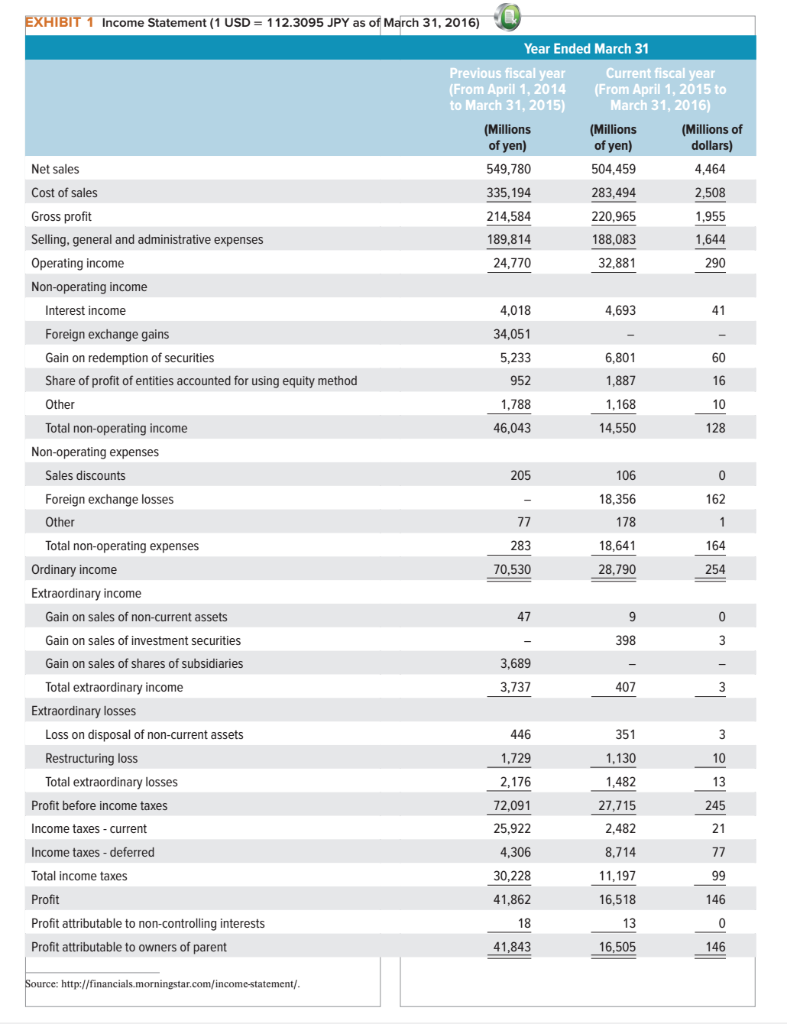
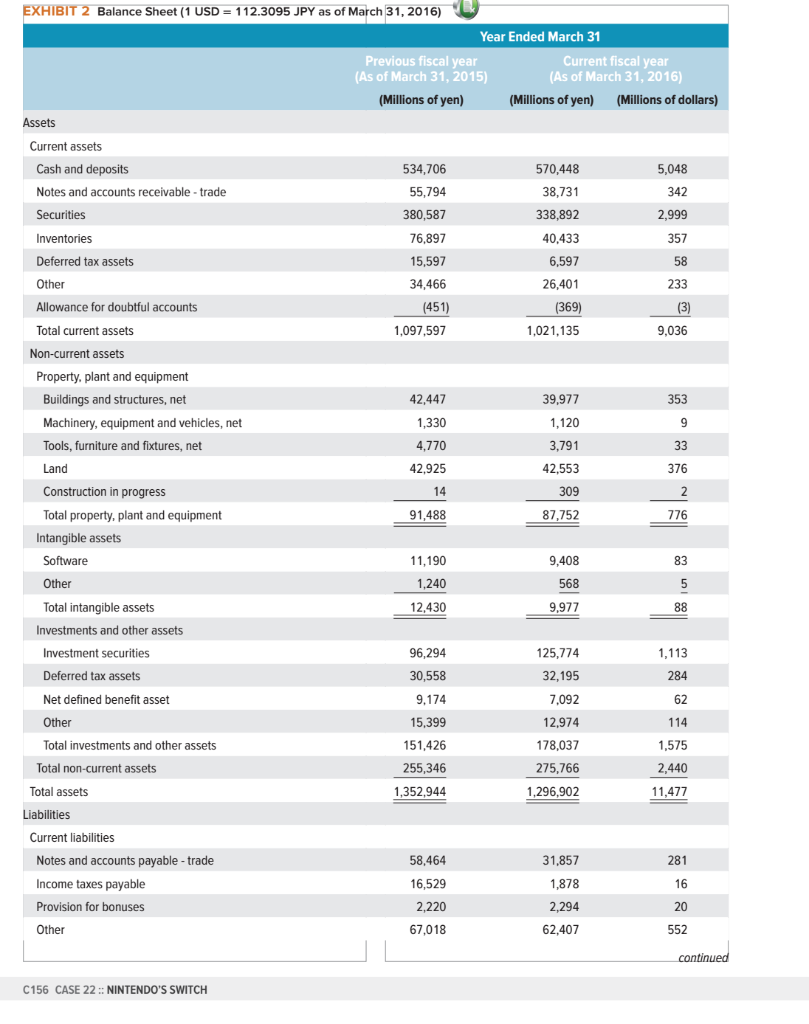
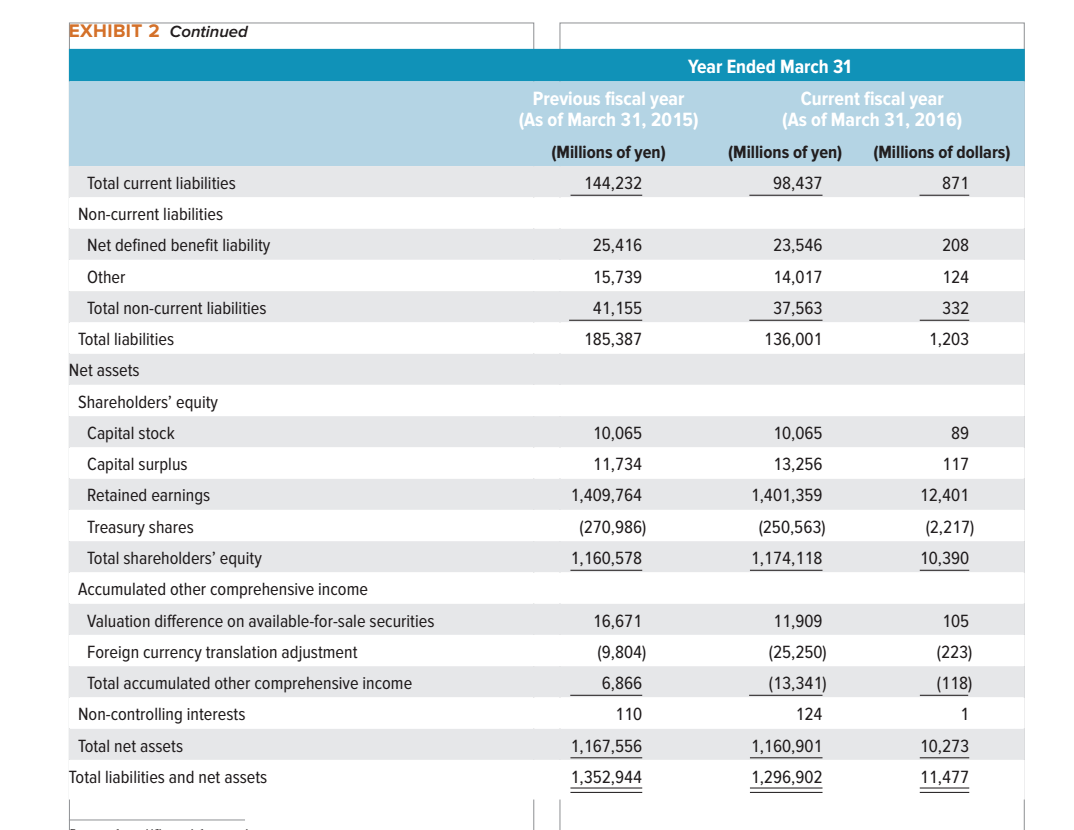
EXHIBIT 1 Income Statement (1 USD = 112.3095 JPY as of March 31, 2016) Year Ended March 31 Previous fiscal year Current fiscal year (From April 1, 2014 (From April 1, 2015 to to March 31, 2015) March 31, 2016) (Millions (Millions (Millions of of yen) of yen) dollars) Net sales 549,780 504,459 4,464 Cost of sales 335,194 283,494 2,508 Gross profit 214,584 220,965 1,955 Selling, general and administrative expenses 189,814 188,083 1,644 Operating income 24,770 32,881 290 Non-operating income Interest income 4,018 4,693 41 Foreign exchange gains 34,051 Gain on redemption of securities 5,233 6,801 60 Share of profit of entities accounted for using equity method 952 1,887 16 Other 1.788 1,168 10 Total non-operating income 46,043 14,550 128 Non-operating expenses - Sales discounts 205 106 0 Foreign exchange losses - 18.356 162 Other 77 178 1 1 Total non-operating expenses 283 18,641 164 Ordinary income 28,790 254 Extraordinary income Gain on sales of non-current assets 47 9 0 Gain on sales of investment securities 398 3 Gain on sales of shares of subsidiaries 3,689 Total extraordinary income 3,737 407 3 Extraordinary losses Loss on disposal of non-current assets - 446 351 3 Restructuring loss 1,729 1,130 10 Total extraordinary losses 2,176 1,482 13 Profit before income taxes 72,091 27,715 245 Income taxes - current 25,922 2,482 21 Income taxes - deferred - 4,306 8,714 77 Total income taxes 30,228 11,197 99 Profit 41,862 16,518 146 Profit attributable to non-controlling interests 18 13 0 Profit attributable to owners of parent 41,843 16,505 146 70,530 - Source: http://financials.morningstar.com/income statement/ EXHIBIT 2 Balance Sheet (1 USD = 112.3095 JPY as of March 31, 2016) Year Ended March 31 Previous fiscal year Current fiscal year (As of March 31, 2015) (As of March 31, 2016) (Millions of yen) (Millions of yen) (Millions of dollars) Assets Current assets 570,448 38,731 5,048 342 Cash and deposits Notes and accounts receivable - trade Securities Inventories Deferred tax assets 338,892 2,999 357 534,706 55,794 380,587 76,897 15,597 34,466 (451) 1,097,597 40,433 6,597 58 Other 26,401 233 Allowance for doubtful accounts (369) (3) 9,036 1,021,135 39,977 353 9 Total current assets Non-current assets Property, plant and equipment Buildings and structures, net Machinery, equipment and vehicles, net Tools, furniture and fixtures, net Land Construction in progress Total property, plant and equipment Intangible assets Software 42,447 1,330 4,770 42,925 1,120 3,791 33 42,553 376 2 14 309 87,752 91,488 776 11,190 9,408 568 83 5 Other 1,240 12,430 9,977 88 Total intangible assets Investments and other assets Investment securities Deferred tax assets 1,113 96,294 30,558 125,774 32,195 284 Net defined benefit asset 9.174 7,092 15,399 12,974 62 114 1,575 151,426 178,037 255,346 275,766 2,440 1,352,944 1,296,902 11,477 Other Total investments and other assets Total non-current assets Total assets Liabilities Current liabilities Notes and accounts payable - trade Income taxes payable Provision for bonuses Other 31.857 281 58,464 16,529 1,878 16 2,220 2,294 20 67,018 62,407 552 continued C156 CASE 22 :: NINTENDO'S SWITCH EXHIBIT 2 Continued Year Ended March 31 Previous fiscal year Current fiscal year (As of March 31, 2015) (As of March 31, 2016) (Millions of yen) (Millions of yen) (Millions of dollars) 144,232 98,437 871 Total current liabilities Non-current liabilities Net defined benefit liability 23,546 208 25,416 15,739 Other 14,017 124 Total non-current liabilities 41,155 37,563 332 Total liabilities 185,387 136,001 1,203 Net assets Shareholders' equity Capital stock 10,065 89 13,256 117 10,065 11,734 1,409,764 (270,986) 1,160,578 12,401 1,401,359 (250,563) 1,174,118 (2,217) 10,390 Capital surplus Retained earnings Treasury shares Total shareholders' equity Accumulated other comprehensive income Valuation difference on available-for-sale securities Foreign currency translation adjustment Total accumulated other comprehensive income Non-controlling interests 16,671 105 (223) (9,804) 6,866 11,909 (25,250) (13,341) 124 (118) 110 1 Total net assets 1,167,556 10,273 1,160,901 1,296,902 Total liabilities and net assets 1,352,944 11,477


