

Answered step by step
Verified Expert Solution
Question
1 Approved Answer
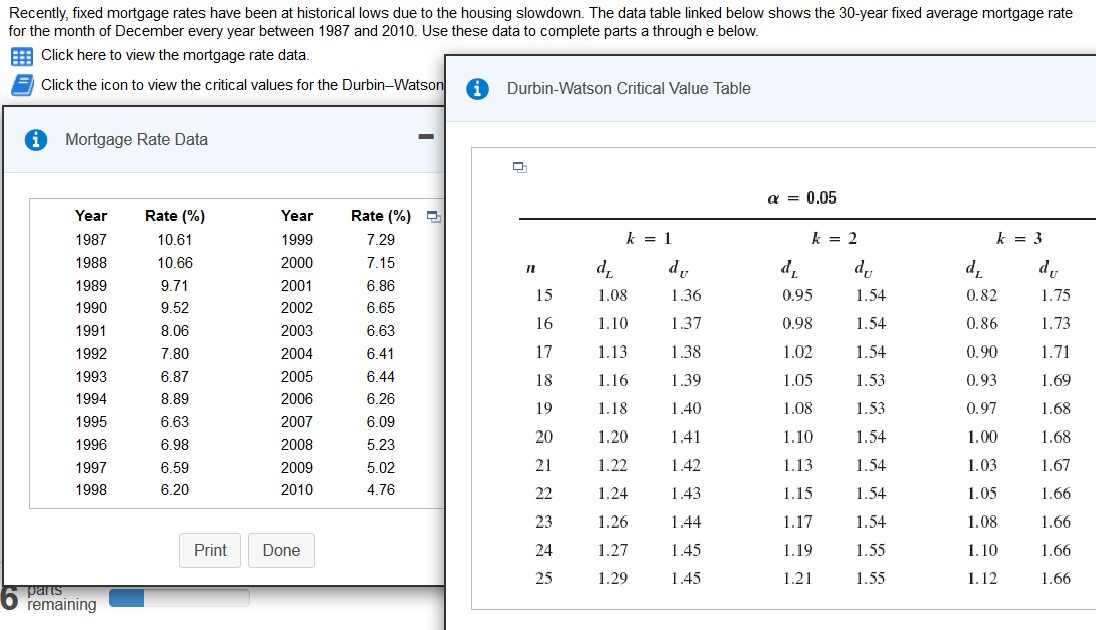
1) Forecast the average December mortgage rate in 2011 using a trend projection, then calculate MAD for this forecast. Next, determine the Durbin-Watson statistic and
1) Forecast the average December mortgage rate in 2011 using a trend projection, then calculate MAD for this forecast. Next, determine the Durbin-Watson statistic and the critical values.
Step by Step Solution
There are 3 Steps involved in it
Step: 1

Get Instant Access to Expert-Tailored Solutions
See step-by-step solutions with expert insights and AI powered tools for academic success
Step: 2

Step: 3
Ace Your Homework with AI
Get the answers you need in no time with our AI-driven, step-by-step assistance
Get Started
Mastering Auditing Essentials A Comprehensive Guide To Learn Auditing Essentials
Authors: Cybellium Ltd, Kris Hermans
1st Edition
B0CHL7H261, 979-8861235617