Answered step by step
Verified Expert Solution
Question
1 Approved Answer
The figure below represents the average plot size and layout for a Pennsylvania farmer with 800 acres of forest on the edge of his


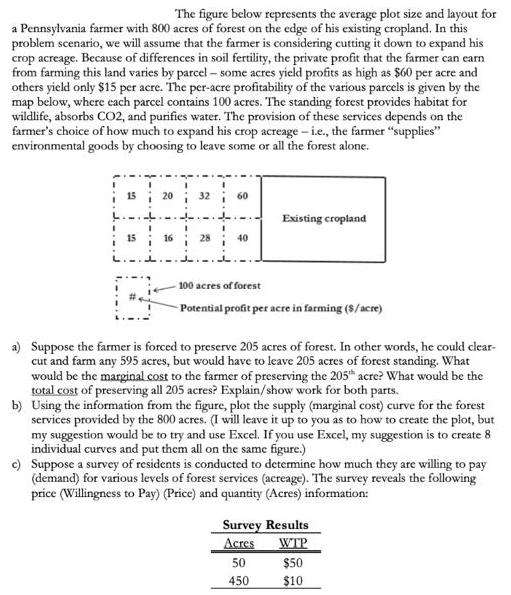
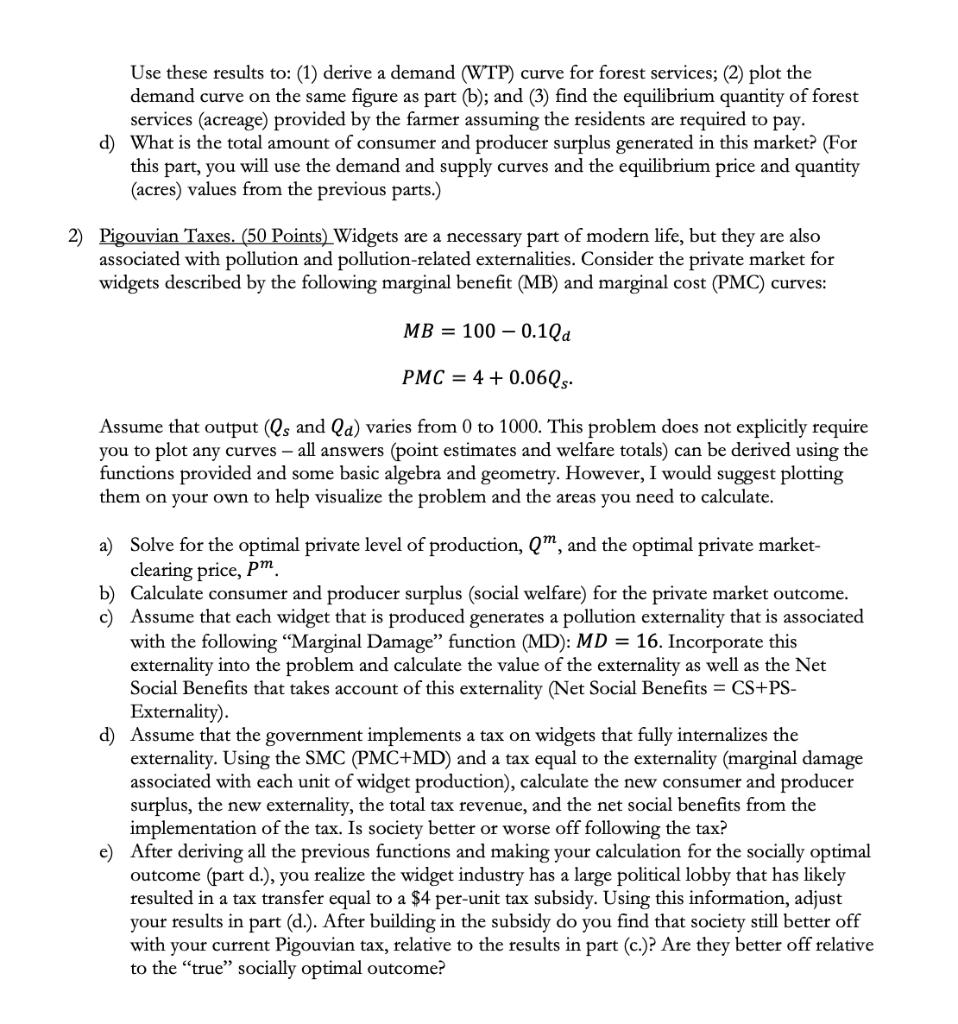
The figure below represents the average plot size and layout for a Pennsylvania farmer with 800 acres of forest on the edge of his existing cropland. In this problem scenario, we will assume that the farmer is considering cutting it down to expand his crop acreage. Because of differences in soil fertility, the private profit that the farmer can earn from farming this land varies by parcel - some acres yield profits as high as $60 per acre and others yield only $15 per acre. The per-acre profitability of the various parcels is given by the map below, where each parcel contains 100 acres. The standing forest provides habitat for wildlife, absorbs CO2, and purifies water. The provision of these services depends on the farmer's choice of how much to expand his crop acreage - i.e., the farmer "supplies" environmental goods by choosing to leave some or all the forest alone. 15 20 32 60 40 Existing cropland -100 acres of forest -Potential profit per acre in farming ($/acre) a) Suppose the farmer is forced to preserve 205 acres of forest. In other words, he could clear- cut and farm any 595 acres, but would have to leave 205 acres of forest standing. What would be the marginal cost to the farmer of preserving the 205 acre? What would be the total cost of preserving all 205 acres? Explain/show work for both parts. b) Using the information from the figure, plot the supply (marginal cost) curve for the forest services provided by the 800 acres. (I will leave it up to you as to how to create the plot, but my suggestion would be to try and use Excel. If you use Excel, my suggestion is to create 8 individual curves and put them all on the same figure.) c) Suppose a survey of residents is conducted to determine how much they are willing to pay (demand) for various levels of forest services (acreage). The survey reveals the following price (Willingness to Pay) (Price) and quantity (Acres) information: Survey Results Acres WTP $50 $10 50 450 Use these results to: (1) derive a demand (WTP) curve for forest services; (2) plot the demand curve on the same figure as part (b); and (3) find the equilibrium quantity of forest services (acreage) provided by the farmer assuming the residents are required to pay. d) What is the total amount of consumer and producer surplus generated in this market? (For this part, you will use the demand and supply curves and the equilibrium price and quantity (acres) values from the previous parts.) 2) Pigouvian Taxes. (50 Points) Widgets are a necessary part of modern life, but they are also associated with pollution and pollution-related externalities. Consider the private market for widgets described by the following marginal benefit (MB) and marginal cost (PMC) curves: MB 1000.1Qa PMC = 4 +0.06Qs. Assume that output (Qs and Qa) varies from 0 to 1000. This problem does not explicitly require you to plot any curves - all answers (point estimates and welfare totals) can be derived using the functions provided and some basic algebra and geometry. However, I would suggest plotting them on your own to help visualize the problem and the areas you need to calculate. a) Solve for the optimal private level of production, Qm, and the optimal private market- clearing price, pm b) Calculate consumer and producer surplus (social welfare) for the private market outcome. c) Assume that each widget that is produced generates a pollution externality that is associated with the following "Marginal Damage" function (MD): MD = 16. Incorporate this externality into the problem and calculate the value of the externality as well as the Net Social Benefits that takes account of this externality (Net Social Benefits = CS+PS- Externality). d) Assume that the government implements a tax on widgets that fully internalizes the externality. Using the SMC (PMC+MD) and a tax equal to the externality (marginal damage associated with each unit of widget production), calculate the new consumer and producer surplus, the new externality, the total tax revenue, and the net social benefits from the implementation of the tax. Is society better or worse off following the tax? e) After deriving all the previous functions and making your calculation for the socially optimal outcome (part d.), you reali: the widget industry has a large political lobby that has likely resulted in a tax transfer equal to a $4 per-unit tax subsidy. Using this information, adjust your results in part (d.). After building in the subsidy do you find that society still better off with your current Pigouvian tax, relative to the results in part (c.)? Are they better off relative to the "true" socially optimal outcome?
Step by Step Solution
★★★★★
3.41 Rating (160 Votes )
There are 3 Steps involved in it
Step: 1
a To calculate the marginal cost of preserving the 205 acres of forest we need to determine the potential profit per acre for the 595 acres that can b...
Get Instant Access to Expert-Tailored Solutions
See step-by-step solutions with expert insights and AI powered tools for academic success
Step: 2

Step: 3

Ace Your Homework with AI
Get the answers you need in no time with our AI-driven, step-by-step assistance
Get Started


