

Answered step by step
Verified Expert Solution
Question
1 Approved Answer
(1.) fUse the value of the linear correlation coefficient r to find the coefficient of determination and the percentage of the total variation that can

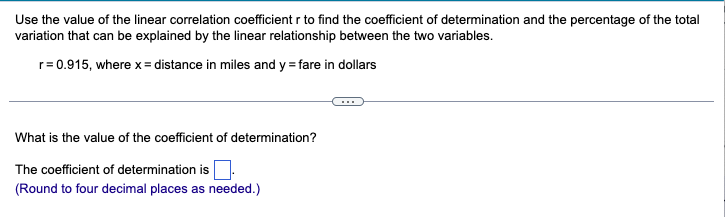


(1.)


Step by Step Solution
There are 3 Steps involved in it
Step: 1

Get Instant Access to Expert-Tailored Solutions
See step-by-step solutions with expert insights and AI powered tools for academic success
Step: 2

Step: 3
Ace Your Homework with AI
Get the answers you need in no time with our AI-driven, step-by-step assistance
Get Started
Encyclopaedia Of General Topology
Authors: Md Mushtaque Khan
1st Edition
9353147530, 9789353147532