

Question: 1) Here is a short script that creates a solution to a common problem. Modify the script so that it produces a complete plot of
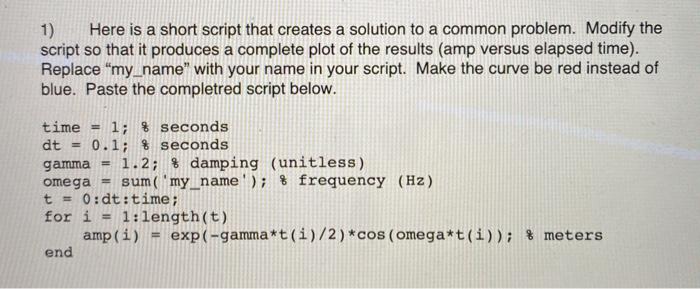

1) Here is a short script that creates a solution to a common problem. Modify the script so that it produces a complete plot of the results (amp versus elapsed time). Replace "my_name" with your name in your script. Make the curve be red instead of blue. Paste the completred script below. time = 1; $seconds dt 0.1; 8 seconds gamma 1.2; % damping (unitless) omega sum('my name'); $ frequency (Hz) t = 0:dt:time; for i 1:length(t) amp (i) exp(-gamma*t(i)/2)*cos (omega*t(i)); % meters end 2) The script above does not produce a good result for the problem because its time step is too big. As you ran it above, how many maxima did it have? How small does dt need to be to get a good looking graph? (This is an example of manually performing a convergence study.)
Step by Step Solution
There are 3 Steps involved in it

Get step-by-step solutions from verified subject matter experts