

Answered step by step
Verified Expert Solution
Question
1 Approved Answer
1: Hiring cost in Chile increases by 25%. 2: Inventory cost increases by 25%. July January 1000 February March 1100 1300 April May 1500 June
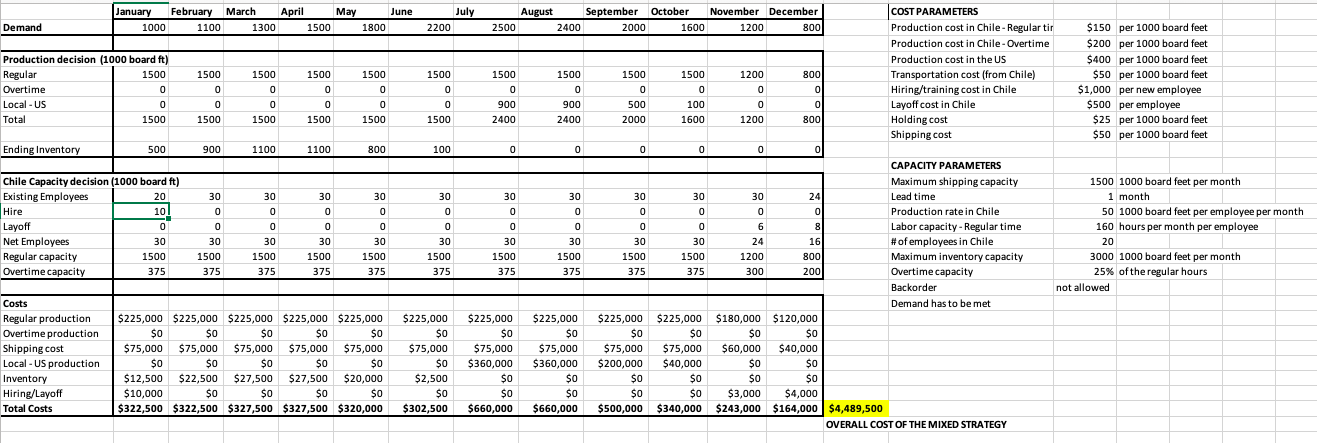 1: Hiring cost in Chile increases by 25%.
2: Inventory cost increases by 25%.
July January 1000 February March 1100 1300 April May 1500 June 1800 August September October November December 2400 2000 1600 1200 800 Demand 1 2200 2500 1500 1500 Production decision (1000 board ft) Regular 1500 Overtime 0 Local - US 0 Total 1500 1200 0 800 1500 0 0 1500 0 1500 0 0 1500 0 1500 0 0 1500 1500 0 900 2400 1500 0 900 2400 COST PARAMETERS Production cost in Chile - Regular tir Production cost in Chile - Overtime Production cost in the US Transportation cost (from Chile) Hiring/training cost in Chile Layoff cost in Chile Holding cost Shipping cost 1500 0 500 2000 $150 per 1000 board feet $200 per 1000 board feet $400 per 1000 board feet $50 per 1000 board feet $1,000 per new employee $500 per employee $25 per 1000 board feet $50 per 1000 board feet 1500 0 100 1600 0 0 0 1500 1500 1200 800 Ending Inventory 500 900 1100 1100 800 100 0 0 0 01 Chile Capacity decision (1000 board ft) Existing Employees 20 30 0 30 0 0 30 0 30 0 30 0 Hire 0 0 o 30 0 0 30 1500 375 Layoff Net Employees Regular capacity Overtime capacity 30 0 0 30 1500 375 30 0 0 30 1500 375 30 0 0 30 1500 375 30 0 0 30 1500 375 241 0 8 16 800 2001 CAPACITY PARAMETERS Maximum shipping capacity Lead time Production rate in Chile Labor capacity - Regular time # of employees in Chile Maximum inventory capacity Overtime capacity Backorder Demand has to be met 1500 1000 board feet per month 1 month 50 1000 board feet per employee per month 160 hours per month per employee 20 3000 1000 board feet per month 25% of the regular hours not allowed 24 1500 375 30 1500 375 1500 375 30 1500 375 30 1500 375 1200 300 Costs Regular production Overtime production Shipping cost Local - US production Inventory Hiring/Layoff Total Costs $225,000 $225,000 $225,000 $225,000 $225,000 $0 $0 $0 $0 $0 $75,000 $75,000 $75,000 $75,000 $75,000 $0 $0 $0 $0 $12,500 $22,500 $27,500 $27,500 $20,000 $10,000 $0 $0 $0 $0 $322,500 $322,500 $327,500 $327,500 $320,000 $180,000 $120,000 $0 $0 $60,000 $40,000 $225,000 $0 $75,000 $0 $2,500 SO $302,500 $225,000 $0 $75,000 $360,000 $225,000 $0 $75,000 $360,000 $0 $0 $660,000 $225,000 $0 $75,000 $200,000 $0 SO $225,000 $0 $75,000 $40,000 $0 $0 $340,000 $0 $o $3,000 $4,000 $243,000 $164,000 $660,000 $500,000 $4,489,500 OVERALL COST OF THE MIXED STRATEGYStep by Step Solution
There are 3 Steps involved in it
Step: 1

Get Instant Access with AI-Powered Solutions
See step-by-step solutions with expert insights and AI powered tools for academic success
Step: 2

Step: 3
Ace Your Homework with AI
Get the answers you need in no time with our AI-driven, step-by-step assistance
Get Started
Intermediate Accounting
Authors: kieso, weygandt and warfield.
14th Edition
9780470587232, 470587288, 470587237, 978-0470587287