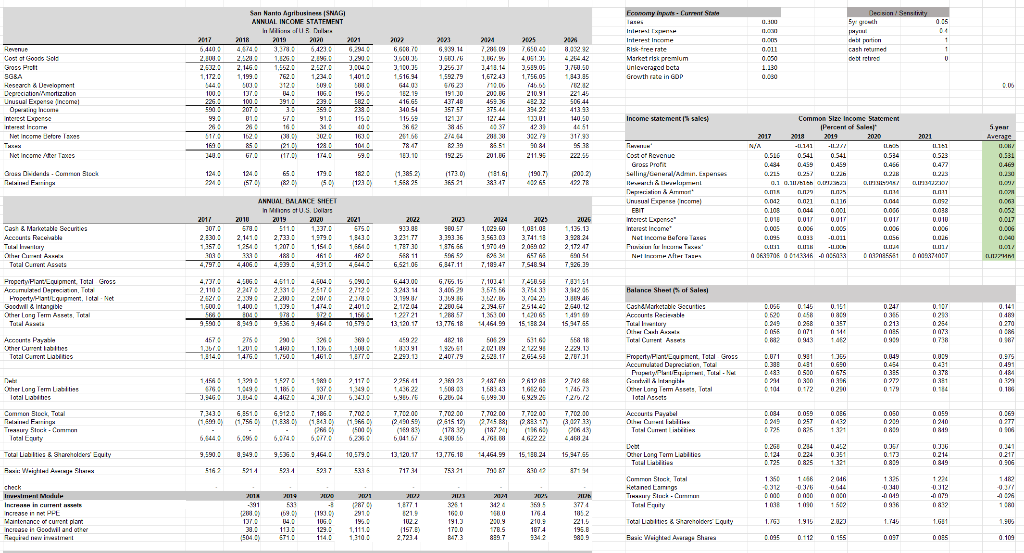
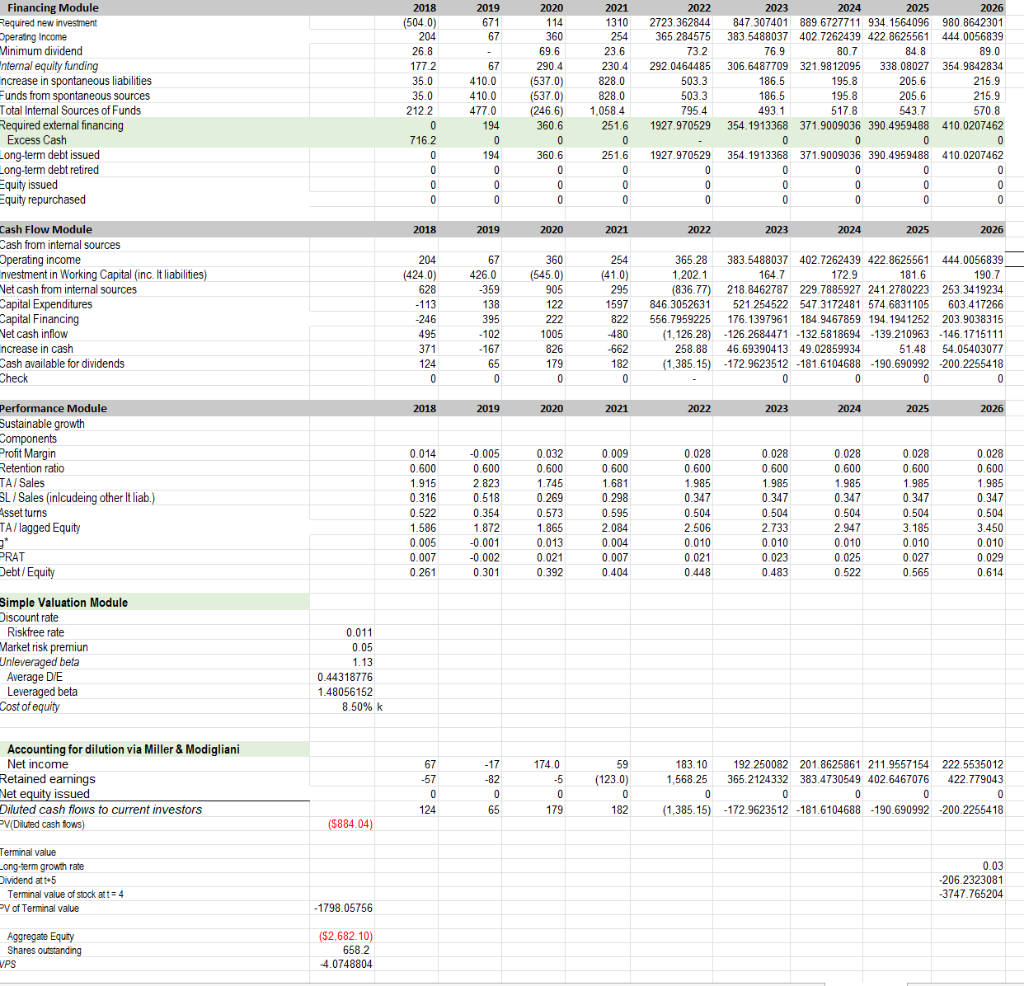
1. How fast can SNAG grow without violating its debt covenants if it uses 100% debt financing and pays out 40% of its earnings as dividends? If it uses 80% debt and 20% equity financing and pays out 40% of its net earnings as dividends?
2. What are the answers to the above questions when the tax rate is 40%?
3. What is SNAGs diluted value per share for each of the above four scenarios? 

| 18011 AM 3 mm a hu - ps ? 1% H. %EE%7B " ommon Size Income Statem * ", Cous Doublide Canage Stact 1.3852 2011 ANNUAL BALANCE SHEET HUU 2011 2.130: 2,1410 2,733 1.979.0 ma m 2026 2.01 100 2021 1843 1 2023 3.393.36 32247 3.741.10 m 563.00 15 4405 6.7.2 1,101.41 Pan.Couport, tatal Groc Pintupnem tal 4,511.3 2.2003 2,048 3.2.1 110 : saias 2013 2 42.18 osa 68769 ==== Other Longlom 14:52 1.6843 2.4905 E o 1.1068 238 349.9 BABYME 6. 6.74 9.990.- 9.949.79.38.2 3456.2 0.73.2 5914 5237 PRE DE 13.120.1 1,75.18 4.48.9 75321 | 97 PECS 15.1982 85047 5347 971 ight Aeg Shui - 993 tenance or curent par *23= Eu Waisted AnsageShare 1. 0097 = 2019 671 67 Financing Module Required new investment Operating Income Minimum dividend Internal equity funding ncrease in spontaneous liabilities Funds from spontaneous sources Total Internal Sources of Funds Required external financing Excess Cash Long-term debt issued Long-term debt retired Equity issued Equity repurchased 2018 (504.0) 204 26.8 177.2 35.0 35.0 212.2 0 716.2 0 0 0 0 0 67 410.0 410.0 477.0 194 0 194 0 0 0 2020 114 360 69.6 290.4 (537.0) (5370) (2466) 3606 0 360.6 0 0 0 2021 1310 254 23.6 230.4 828.0 828.0 1,058.4 251.6 0 251.6 0 0 0 0 2022 2723.362844 365 284575 732 292.0464485 503.3 503.3 795.4 1927.970529 2023 2024 2025 2026 847.307401 889.6727711 934. 1564096 980.8642301 383.5488037 402 7262439 422.8625561 444.0056839 76.9 80.7 84.8 89.0 306.6487709 321.9812095 338.08027 354.9842834 186.5 195.8 205.6 215.9 186.5 195.8 205.6 215.9 493.1 517.8 543.7 570.8 354.1913368 371.9009036 390.4959488 410.0207462 0 0 0 0 354.1913368 371.9009036 390.4959488 410.0207462 0 0 0 0 0 0 0 0 0 0 0 0 0 0 0 1927.970529 0 0 0 0 2018 2019 2020 2021 2022 2023 2024 2025 2026 Cash Flow Module Dash from internal sources Operating income Investment in Working Capital (inc. It liabilities) Vet cash from internal sources Capital Expenditures Capital Financing Vet cash inflow ncrease in cash Cash available for dividends Check 204 (424.0) 628 - 113 -246 495 371 124 0 67 426.0 -359 138 395 -102 - 167 65 0 360 (545.0) 905 122 222 1005 826 179 0 254 (410) 295 1597 822 -480 -662 182 0 365.28 383.5488037 402.7262439 422.8625561 444.0056839 1,202.1 164.7 172.9 181.6 190.7 (836.77) 218.8462787 229.7885927 241.2780223 253.3419234 846.3052631 521.254522 547.3172481 574.6831105 603.417266 556.7959225 176.1397961 184.9467859 194.1941252 203.9038315 (1,126.28) -126.2684471 -132.5818694 -139 210963 -146.1715111 258.88 46.69390413 49.02859934 51.48 54.05403077 (1.385.15) -172.9623512 -181.6104688 -190.690992 -200.2255418 0 0 0 0 0 2018 2019 2020 2021 2022 2023 2024 2025 2026 Performance Module Sustainable growth Components Profit Margin Retention ratio TA/ Sales SL/Sales (inlcudeing other It liab.) Asset turns TA/lagged Equity 0.014 0.600 1.915 0.316 0.522 1.586 0.005 0.007 0.261 -0.005 0.600 2.823 0.518 0.354 1.872 -0.001 -0.002 0.301 0.032 0.600 1.745 0.269 0.573 1.865 0.013 0.021 0.392 0.009 0.600 1.681 0.298 0.595 2.084 0.004 0.007 0.404 0.028 0.600 1.985 0.347 0.504 2.506 0.010 0.021 0.448 0.028 0.600 1.985 0.347 0.504 2.733 0.010 0.023 0.483 0.028 0.600 1.985 0.347 0.504 2.947 0.010 0.025 0.522 0.028 0.600 1.985 0.347 0.504 3.185 0.010 0.027 0.565 0.028 0.600 1.985 0.347 0.504 3.450 0.010 0.029 0.614 SRAT Debt/Equity 0.011 0.05 Simple Valuation Module Discount rate Riskfree rate Market risk premiun Unleveraged beta Average DIE Leveraged beta Cost of equity 1.13 0.44318776 1.48056152 8.50% k Accounting for dilution via Miller & Modigliani Net income Retained earnings Net equity issued Diluted cash flows to current investors V Diluted cash fows) 67 -57 0 124 -17 -82 0 65 174 0 -5 0 179 59 (123.0) 0 0 182 183.10 192.250082 201.8625861 211.9557154 222.5535012 1,568.25 365.2124332 383.4730549 402.6467076 422.779043 0 0 0 0 0 0 (1,385.15) -172.9623512 -181.6104688 -190.690992-200.2255418 (5884.04) Terminal value Long-term growth rate Dividend att 5 Terminal value of stock att = 4 V of Terminal value 0.03 206.2323081 3747.765204 -1798.05756 Aggregate Equity Shares outstanding VPS (52.682.10) 658.2 -4.0748804 | 18011 AM 3 mm a hu - ps ? 1% H. %EE%7B " ommon Size Income Statem * ", Cous Doublide Canage Stact 1.3852 2011 ANNUAL BALANCE SHEET HUU 2011 2.130: 2,1410 2,733 1.979.0 ma m 2026 2.01 100 2021 1843 1 2023 3.393.36 32247 3.741.10 m 563.00 15 4405 6.7.2 1,101.41 Pan.Couport, tatal Groc Pintupnem tal 4,511.3 2.2003 2,048 3.2.1 110 : saias 2013 2 42.18 osa 68769 ==== Other Longlom 14:52 1.6843 2.4905 E o 1.1068 238 349.9 BABYME 6. 6.74 9.990.- 9.949.79.38.2 3456.2 0.73.2 5914 5237 PRE DE 13.120.1 1,75.18 4.48.9 75321 | 97 PECS 15.1982 85047 5347 971 ight Aeg Shui - 993 tenance or curent par *23= Eu Waisted AnsageShare 1. 0097 = 2019 671 67 Financing Module Required new investment Operating Income Minimum dividend Internal equity funding ncrease in spontaneous liabilities Funds from spontaneous sources Total Internal Sources of Funds Required external financing Excess Cash Long-term debt issued Long-term debt retired Equity issued Equity repurchased 2018 (504.0) 204 26.8 177.2 35.0 35.0 212.2 0 716.2 0 0 0 0 0 67 410.0 410.0 477.0 194 0 194 0 0 0 2020 114 360 69.6 290.4 (537.0) (5370) (2466) 3606 0 360.6 0 0 0 2021 1310 254 23.6 230.4 828.0 828.0 1,058.4 251.6 0 251.6 0 0 0 0 2022 2723.362844 365 284575 732 292.0464485 503.3 503.3 795.4 1927.970529 2023 2024 2025 2026 847.307401 889.6727711 934. 1564096 980.8642301 383.5488037 402 7262439 422.8625561 444.0056839 76.9 80.7 84.8 89.0 306.6487709 321.9812095 338.08027 354.9842834 186.5 195.8 205.6 215.9 186.5 195.8 205.6 215.9 493.1 517.8 543.7 570.8 354.1913368 371.9009036 390.4959488 410.0207462 0 0 0 0 354.1913368 371.9009036 390.4959488 410.0207462 0 0 0 0 0 0 0 0 0 0 0 0 0 0 0 1927.970529 0 0 0 0 2018 2019 2020 2021 2022 2023 2024 2025 2026 Cash Flow Module Dash from internal sources Operating income Investment in Working Capital (inc. It liabilities) Vet cash from internal sources Capital Expenditures Capital Financing Vet cash inflow ncrease in cash Cash available for dividends Check 204 (424.0) 628 - 113 -246 495 371 124 0 67 426.0 -359 138 395 -102 - 167 65 0 360 (545.0) 905 122 222 1005 826 179 0 254 (410) 295 1597 822 -480 -662 182 0 365.28 383.5488037 402.7262439 422.8625561 444.0056839 1,202.1 164.7 172.9 181.6 190.7 (836.77) 218.8462787 229.7885927 241.2780223 253.3419234 846.3052631 521.254522 547.3172481 574.6831105 603.417266 556.7959225 176.1397961 184.9467859 194.1941252 203.9038315 (1,126.28) -126.2684471 -132.5818694 -139 210963 -146.1715111 258.88 46.69390413 49.02859934 51.48 54.05403077 (1.385.15) -172.9623512 -181.6104688 -190.690992 -200.2255418 0 0 0 0 0 2018 2019 2020 2021 2022 2023 2024 2025 2026 Performance Module Sustainable growth Components Profit Margin Retention ratio TA/ Sales SL/Sales (inlcudeing other It liab.) Asset turns TA/lagged Equity 0.014 0.600 1.915 0.316 0.522 1.586 0.005 0.007 0.261 -0.005 0.600 2.823 0.518 0.354 1.872 -0.001 -0.002 0.301 0.032 0.600 1.745 0.269 0.573 1.865 0.013 0.021 0.392 0.009 0.600 1.681 0.298 0.595 2.084 0.004 0.007 0.404 0.028 0.600 1.985 0.347 0.504 2.506 0.010 0.021 0.448 0.028 0.600 1.985 0.347 0.504 2.733 0.010 0.023 0.483 0.028 0.600 1.985 0.347 0.504 2.947 0.010 0.025 0.522 0.028 0.600 1.985 0.347 0.504 3.185 0.010 0.027 0.565 0.028 0.600 1.985 0.347 0.504 3.450 0.010 0.029 0.614 SRAT Debt/Equity 0.011 0.05 Simple Valuation Module Discount rate Riskfree rate Market risk premiun Unleveraged beta Average DIE Leveraged beta Cost of equity 1.13 0.44318776 1.48056152 8.50% k Accounting for dilution via Miller & Modigliani Net income Retained earnings Net equity issued Diluted cash flows to current investors V Diluted cash fows) 67 -57 0 124 -17 -82 0 65 174 0 -5 0 179 59 (123.0) 0 0 182 183.10 192.250082 201.8625861 211.9557154 222.5535012 1,568.25 365.2124332 383.4730549 402.6467076 422.779043 0 0 0 0 0 0 (1,385.15) -172.9623512 -181.6104688 -190.690992-200.2255418 (5884.04) Terminal value Long-term growth rate Dividend att 5 Terminal value of stock att = 4 V of Terminal value 0.03 206.2323081 3747.765204 -1798.05756 Aggregate Equity Shares outstanding VPS (52.682.10) 658.2 -4.0748804


