

Answered step by step
Verified Expert Solution
Question
1 Approved Answer
1) Identification of Indep and Dep Var 2) Scatter diagram and general comments (simple regression only) (only done for simple regression) 3) Identification and Analysis
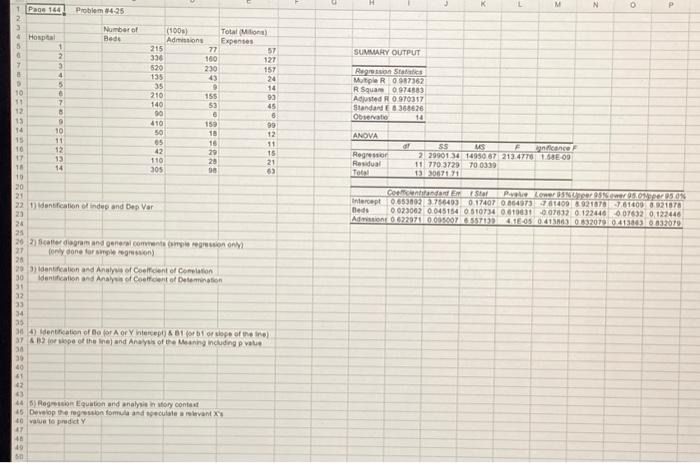
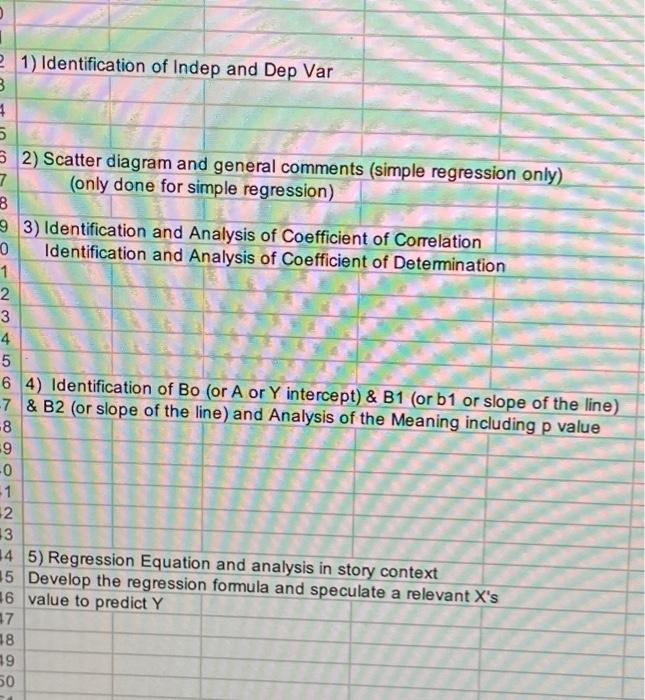
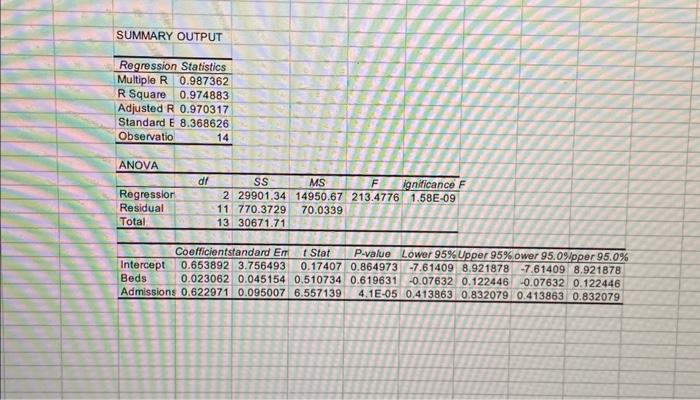 1) Identification of Indep and Dep Var 2) Scatter diagram and general comments (simple regression only) (only done for simple regression) 3) Identification and Analysis of Coefficient of Correlation Identification and Analysis of Coefficient of Determination 4) Identification of Bo (or A or Y intercept) \& B1 (or b1 or slope of the line) & B2 (or slope of the line) and Analysis of the Meaning including P value 5) Regression Equation and analysis in story context Develop the regression formula and speculate a relevant X's value to predict Y SUMMARY OUTPUT \begin{tabular}{lr} \hline Regression & Statistics \\ \hline Multiple R & 0.987362 \\ \hline R Square & 0.974883 \\ \hline Adjusted R & 0.970317 \\ \hline Standard E & 8.368626 \\ \hline Observatio & 14 \\ \hline \end{tabular} ANOVA \begin{tabular}{lrrrrrr} \hline & \multicolumn{1}{c}{d} & \multicolumn{1}{c}{ SS } & \multicolumn{1}{c}{ MS } & F & ignificance F \\ \hline Regression & 2 & 29901.34 & 14950.67 & 213.4776 & 1.58E09 \\ Residual & 11 & 770.3729 & 70.0339 & & \\ \hline Total & 13 & 30671.71 & & & \\ \hline \end{tabular} \begin{tabular}{|l|c|c|c|c|c|c|c|c|} \hline & Coefficientstandard Em & \multicolumn{1}{c}{ Stat } & P-value & Lower 95\% Upper 95\% ower 95.0\%/pper 95.0\% \\ \hline Intercept & 0.653892 & 3.756493 & 0.17407 & 0.864973 & -7.61409 & 8.921878 & -7.61409 & 8.921878 \\ \hline Beds & 0.023062 & 0.045154 & 0.510734 & 0.619631 & -0.07632 & 0.122446 & -0.07632 & 0.122446 \\ \hline Admissions & 0.622971 & 0.095007 & 6.557139 & 4.1E05 & 0.413863 & 0.832079 & 0.413863 & 0.832079 \\ \hline \end{tabular} 1) Identification of Indep and Dep Var 2) Scatter diagram and general comments (simple regression only) (only done for simple regression) 3) Identification and Analysis of Coefficient of Correlation Identification and Analysis of Coefficient of Determination 4) Identification of Bo (or A or Y intercept) \& B1 (or b1 or slope of the line) & B2 (or slope of the line) and Analysis of the Meaning including P value 5) Regression Equation and analysis in story context Develop the regression formula and speculate a relevant X's value to predict Y SUMMARY OUTPUT \begin{tabular}{lr} \hline Regression & Statistics \\ \hline Multiple R & 0.987362 \\ \hline R Square & 0.974883 \\ \hline Adjusted R & 0.970317 \\ \hline Standard E & 8.368626 \\ \hline Observatio & 14 \\ \hline \end{tabular} ANOVA \begin{tabular}{lrrrrrr} \hline & \multicolumn{1}{c}{d} & \multicolumn{1}{c}{ SS } & \multicolumn{1}{c}{ MS } & F & ignificance F \\ \hline Regression & 2 & 29901.34 & 14950.67 & 213.4776 & 1.58E09 \\ Residual & 11 & 770.3729 & 70.0339 & & \\ \hline Total & 13 & 30671.71 & & & \\ \hline \end{tabular} \begin{tabular}{|l|c|c|c|c|c|c|c|c|} \hline & Coefficientstandard Em & \multicolumn{1}{c}{ Stat } & P-value & Lower 95\% Upper 95\% ower 95.0\%/pper 95.0\% \\ \hline Intercept & 0.653892 & 3.756493 & 0.17407 & 0.864973 & -7.61409 & 8.921878 & -7.61409 & 8.921878 \\ \hline Beds & 0.023062 & 0.045154 & 0.510734 & 0.619631 & -0.07632 & 0.122446 & -0.07632 & 0.122446 \\ \hline Admissions & 0.622971 & 0.095007 & 6.557139 & 4.1E05 & 0.413863 & 0.832079 & 0.413863 & 0.832079 \\ \hline \end{tabular}
Step by Step Solution
There are 3 Steps involved in it
Step: 1

Get Instant Access with AI-Powered Solutions
See step-by-step solutions with expert insights and AI powered tools for academic success
Step: 2

Step: 3
Ace Your Homework with AI
Get the answers you need in no time with our AI-driven, step-by-step assistance
Get Started