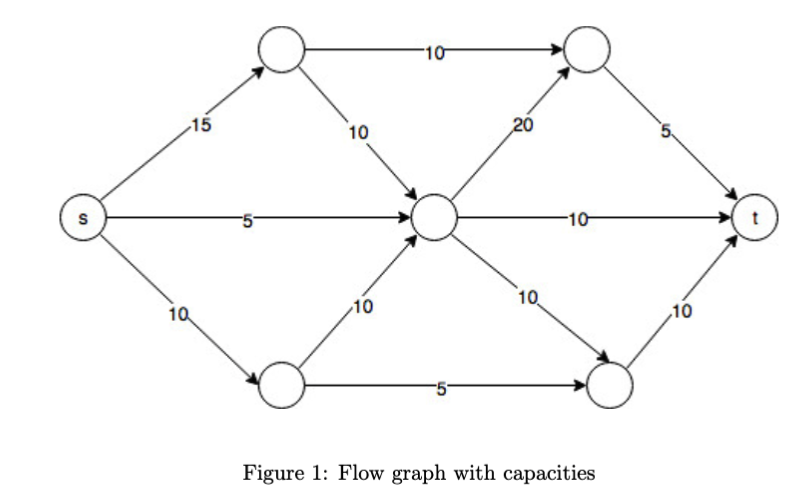

= 1. Illustrate the Ford-Fulkerson algorithm for the graph of Figure 1 on the next page. Show all the intermediate steps, not just the final result. [5 points] 2. Exercise 5.18, part (a), left column only (DPV book). Now, only consider the left column of the table for problem 5.18: characters blank, e, t, a, o, i, n, s, h with the given frequencies. Show the tree construction, and also the resultant Huffman encoding of these characters. [5 points) 3. You are running a software company and have a series of n jobs that must be pre-processed first on a supercomputer before being moved to a smaller PC. You have only one super- computer, but you have n PCs so the second stage can be performed in parallel. More specifically, your jobs are described as J1 = (81, fi), J2 = (82, f2),...,Jn (sn, fn), where job Ji needs si units of time to be pre-processed on the super-computer and fi units of time on the PC. You need to work out an order in which to give the jobs to the super-computer. As soon as the first job is done on the super-computer, it can be moved to the PC for finishing; at that point a second job can be given to the super-computer; when the second job is done it can go straight to a PC since the PCs can work in parallel, and so on. So if the jobs are processed in the order given, job J finishes at time (Ex=1 Sk) + fi. A schedule is an ordering of the jobs to be given to the super-computer. The completion time is the point at which all jobs have finished being processed on the PCs. We wish to minimize the completion time. (a) Give a greedy algorithm for computing the optimal order in which to process the jobs so that the completion time is minimized. [5 points) (b) Prove the greedy choice your algorithm makes is correct. (Hint: Refer to what we did during the class for the proof for the task scheduling problem.) (15 extra points) -10 -15 10 20 5. s -10 t 10 10 10 10 Figure 1: Flow graph with capacities = 1. Illustrate the Ford-Fulkerson algorithm for the graph of Figure 1 on the next page. Show all the intermediate steps, not just the final result. [5 points] 2. Exercise 5.18, part (a), left column only (DPV book). Now, only consider the left column of the table for problem 5.18: characters blank, e, t, a, o, i, n, s, h with the given frequencies. Show the tree construction, and also the resultant Huffman encoding of these characters. [5 points) 3. You are running a software company and have a series of n jobs that must be pre-processed first on a supercomputer before being moved to a smaller PC. You have only one super- computer, but you have n PCs so the second stage can be performed in parallel. More specifically, your jobs are described as J1 = (81, fi), J2 = (82, f2),...,Jn (sn, fn), where job Ji needs si units of time to be pre-processed on the super-computer and fi units of time on the PC. You need to work out an order in which to give the jobs to the super-computer. As soon as the first job is done on the super-computer, it can be moved to the PC for finishing; at that point a second job can be given to the super-computer; when the second job is done it can go straight to a PC since the PCs can work in parallel, and so on. So if the jobs are processed in the order given, job J finishes at time (Ex=1 Sk) + fi. A schedule is an ordering of the jobs to be given to the super-computer. The completion time is the point at which all jobs have finished being processed on the PCs. We wish to minimize the completion time. (a) Give a greedy algorithm for computing the optimal order in which to process the jobs so that the completion time is minimized. [5 points) (b) Prove the greedy choice your algorithm makes is correct. (Hint: Refer to what we did during the class for the proof for the task scheduling problem.) (15 extra points) -10 -15 10 20 5. s -10 t 10 10 10 10 Figure 1: Flow graph with capacities


