Answered step by step
Verified Expert Solution
Link Copied!

Question

1 Approved Answer

1. In each of the following cases, draw a graph showing an increase or decrease in equilibrium interest rates. a. Suppose the demand for loanable
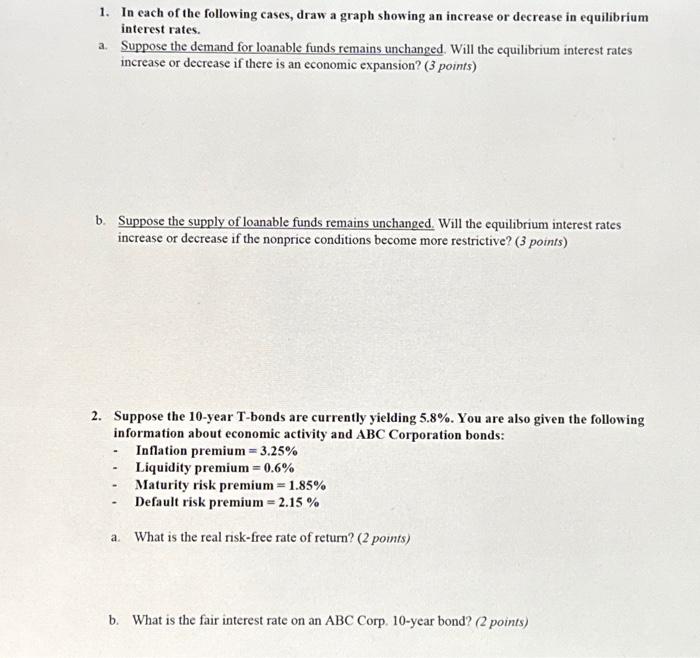
image text in transcribed
1. In each of the following cases, draw a graph showing an increase or decrease in equilibrium interest rates. a. Suppose the demand for loanable funds remains unchanged. Will the equilibrium interest rates increase or decrease if there is an economic expansion? ( 3 points) b. Suppose the supply of loanable funds remains unchanged. Will the equilibrium interest rates increase or decrease if the nonprice conditions become more restrictive? (3 points) 2. Suppose the 10-year T-bonds are currently yielding 5.8%. You are also given the following information about economic activity and ABC Corporation bonds: - Inflation premium =3.25% - Liquidity premium =0.6% - Maturity risk premium =1.85% - Default risk premium =2.15% a. What is the real risk-free rate of return? (2 points) b. What is the fair interest rate on an ABC Corp. 10-year bond? ( 2 points)

Step by Step Solution

There are 3 Steps involved in it

Step: 1

blur-text-image

Get Instant Access to Expert-Tailored Solutions

See step-by-step solutions with expert insights and AI powered tools for academic success

Step: 2

blur-text-image_2

Step: 3

blur-text-image_3

Ace Your Homework with AI

Get the answers you need in no time with our AI-driven, step-by-step assistance

Get Started

Recommended Textbook for

Numerical Techniques In Finance

Authors: Simon Benninga

1st Edition

0262022869, 978-0262022866

More Books

Students also viewed these Finance questions

Question

Responsibilities and duties of IEEE

Answered: 1 week ago

Question

c. Determine the confidence intervals of the linearised parameters.

Answered: 1 week ago