Question: 1} In this lab, you will need to enter many statistical formula to derive answers from Excel. 2) For all graphs and charts, please label


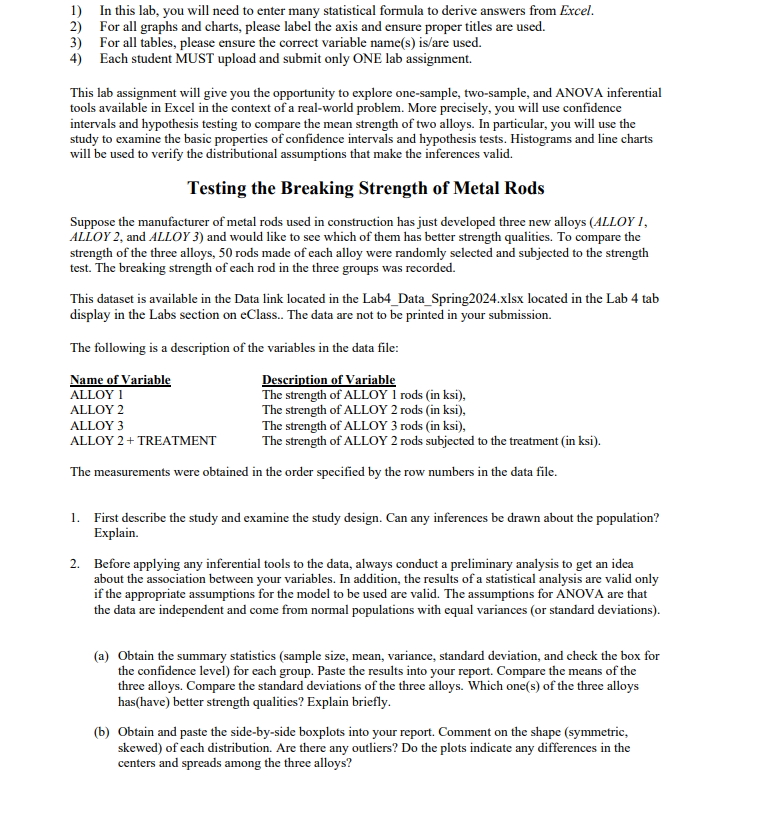
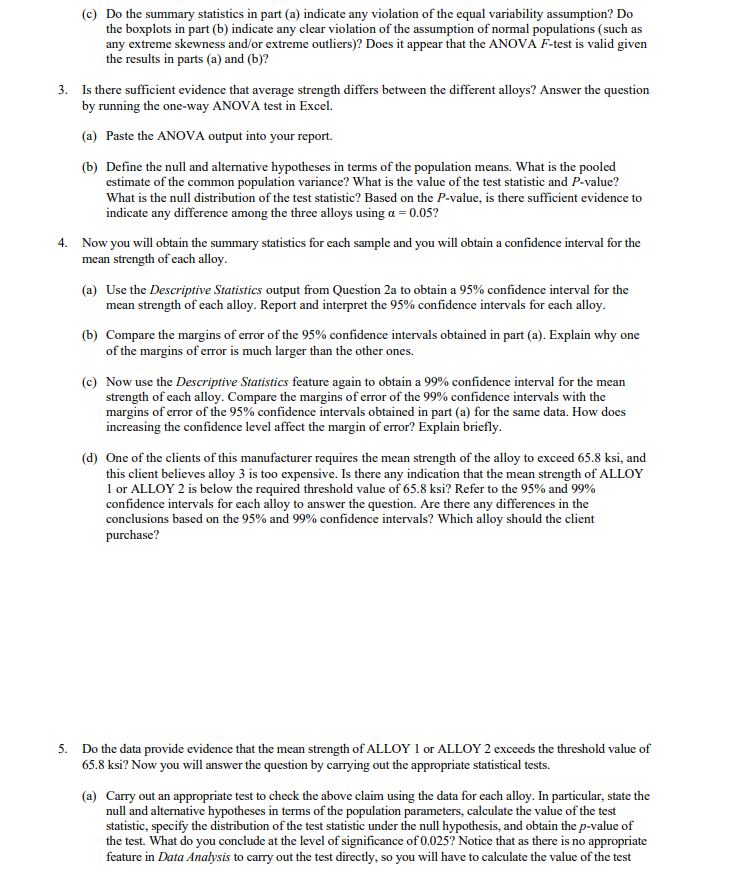
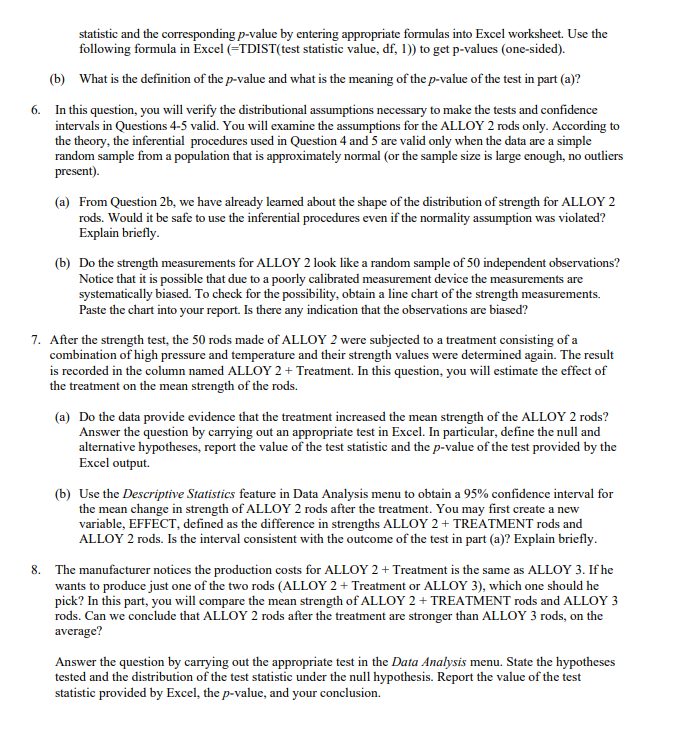
1} In this lab, you will need to enter many statistical formula to derive answers from Excel. 2) For all graphs and charts, please label the axis and ensure proper titles are used. 3) For all tables, please ensure the correct variable namey(s) is/are used. 4) Each student MUST upload and submit only ONE lab assignment. This lab assignment will give you the opportunity to explore one-sample, two-sample, and ANOWVA inferential tools available in Excel in the context of a real-world problem. More precisely, you will use confidence intervals and hypothesis testing to compare the mean strength of two alloys. In particular, vou will use the study to examine the basic properties of confidence intervals and hypothesis tests. Histograms and line charts will be used to verify the distnbutional assumptions that make the inferences valid. Testing the Breaking Strength of Metal Rods Suppose the manufacturer of metal rods used in construction has just developed three new alloys (ALLOY [, ALLOY 2, and ALLOY 3) and would like to see which of them has better strength qualities. To compare the strength of the three alloys, 50 rods made of each alloy were randomly selected and subjected to the strength test. The breaking strength of each rod in the three groups was recorded. This dataset is available in the Data link located in the Lab4 Data Spring2(24.x1sx located in the Lab 4 tab display in the Labs section on eClass.. The data are not to be printed in yvour submission. The following is a descrniption of the vanables in the data file: Mame of Variable Description of Variable ALLOY | The strength of ALLOY 1 rods (in ksi), ALLOY 2 The strength of ALLOY 2 rods (in ksi), ALLOY 3 The strength of ALLOY 3 rods (in ksi), ALLOY 2+ TREATMENT The strength of ALLOY 2 rods subjected to the treatment (in ksi). The measurements were obtained in the order specified by the row numbers in the data file. 1. First describe the study and examine the study design. Can any inferences be drawn about the population? Explain. 2. Before applying any inferential tools to the data, always conduct a preliminary analysis to get an idea about the association between your variables. In addition, the results of a statistical analysis are valid only if the appropriate assumptions for the model to be used are valid. The assumptions for ANOVA are that the data are independent and come from normal populations with equal variances (or standard deviations). {a) Obtain the summary statistics (sample size, mean, variance, standard deviation, and check the box for the confidence level) for each group. Paste the results into your report. Compare the means of the three alloys. Compare the standard deviations of the three alloys. Which one(s) of the three alloys has(have) better strength qualities? Explain briefly. (b} Obtain and paste the side-by-side boxplots into your report. Comment on the shape (symmetric, skewed) of each distribution. Are there any outliers? Do the plots indicate any differences in the centers and spreads among the three alloys? {c) Do the summary statistics in part (a) indicate any violation of the equal vanability assumption? Do the boxplots in part (b) indicate any clear vielation of the assumption of normal populations (such as any extreme skewness and/or extreme outliers)? Does it appear that the ANOVA F-test 1s valid given the results in parts (a) and (b)? i. Isthere sufficient evidence that average strength differs between the different alloys? Answer the question by running the one-way ANOVA test in Excel. {a) Paste the ANOVA output into your report. {b) Define the null and alternative hypotheses in terms of the population means. What is the pooled estimate of the common population variance? What is the value of the test statistic and P-value? What is the null distribution of the test statistic? Based on the FP-value, 1s there sufficient evidence to indicate any difference among the three alloys using a = 0.057 4. MNow you will obtain the summary statistics for each sample and you will obtain a confidence interval for the mean strength of cach alloy. {a) Use the Descriptive Statistics output from Question 2a to obtain a 95% confidence mterval for the mean strength of each alloy. Report and interpret the 95% confidence intervals for each alloy. {b) Compare the margins of error of the 95% confidence intervals obtained in part {a). Explain why one of the margins of error 1s much larger than the other ones. {c) MNow use the Descriprive Staristics feature again to obtain a 99% confidence interval for the mean strength of each alloy. Compare the margins of error of the 99% confidence intervals with the margins of error of the 95% confidence intervals obtained in part (a) for the same data. How does increasing the confidence level affect the margin of error? Explain briefly. {d) One of the clients of this manufacturer requires the mean strength of the alloy to exceed 65.8 ksi, and this client believes alloy 3 is too expensive. Is there any indication that the mean strength of ALLOY 1 or ALLOY 2 is below the required threshold value of 65.8 ksi? Refer to the 95% and 99% confidence intervals for each alloy to answer the question. Are there any differences in the conclusions based on the 95% and 99% confidence intervals? Which alloy should the client purchase? 5. Do the data provide evidence that the mean strength of ALLOY 1 or ALLOY 2 exceeds the threshold value of 65.8 ksi? Now you will answer the question by carrying out the appropriate statistical tests. (a) Carry out an appropriate test to check the above claim using the data tor each alloy. In particular, state the null and alternative hypotheses in terms of the population parameters, calculate the value of the test statistic, specify the distribution of the test statistic under the null hypothesis, and obtain the p-value of the test. What do you conclude at the level of significance of (L.0257 Notice that as there i1s no appropriate teature in Data Analysis to carry out the test directly, so you will have to calculate the value of the test statistic and the corresponding p-value by entering appropriate formulas mto Excel worksheet. Use the following formula in Excel (=TDIST(test statistic value, df, 1)) to get p-values (one-sided). (b) What is the definition of the p-value and what is the meaning of the p-value of the test in part (a)? 6. In this question, you will verify the distributional assumptions necessary to make the tests and confidence intervals in Questions 4-5 valid. You will examine the assumptions for the ALLOY 2 rods only. According to the theory, the inferential procedures used in Question 4 and 5 are valid only when the data are a simple random sample from a population that 1s approximately normal (or the sample size 1s large enough, no outliers presemnt). {a) From Question 2b, we have already leamed about the shape of the distnbution of strength for ALLOY 2 rads. Would it be safe to use the inferential procedures even if the normality assumption was violated? Explam briefly. {b) Do the strength measurements for ALLOY 2 look like a random sample of 50 independent observations? Notice that it is possible that due to a poorly calibrated measurement device the measurements are systematically biased. To check for the possibility, obtain a line chart of the strength measurements. Paste the chart into your report. Is there any indication that the observations are biased? 7. After the strength test, the 50 rods made of ALLOY 2 were subjected to a treatment consisting of a combination of high pressure and temperature and their strength values were determined again. The result is recorded in the column named ALLOY 2 + Treatment. In this question, you will estimate the effect of the treatment on the mean strength of the rods. {a) Do the data provide evidence that the treatment mcreased the mean strength of the ALLOY 2 rods? Answer the question by carrying out an appropriate test in Excel. In particular, define the null and alternative hypotheses, report the value of the test statistic and the p-value of the test provided by the Excel output. (b) Use the Descriptive Statistics feature in Data Analysis menu to obtain a 95% confidence interval for the mean change in strength of ALLOY 2 rods after the treatment. You may first create a new variable, EFFECT, defined as the difference in strengths ALLOY 2 + TREATMENT rods and ALLOY 2 rods. Is the interval consistent with the outcome of the test in part (a)? Explain briefly. 8. The manufacturer notices the production costs for ALLOY 2 + Treatment is the same as ALLOY 3. If he wants to produce just one of the two rods (ALLOY 2 + Treatment or ALLOY 3}, which one should he pick? In this part, you will compare the mean strength of ALLOY 2 + TREATMENT rods and ALLOY 3 rods. Can we conclude that ALLOY 2 rods after the treatment are stronger than ALLOY 3 rods, on the average? Answer the question by carrying out the appropriate test in the Data Anafysis menu. State the hypotheses tested and the distribution of the test statistic under the null hypothesis. Report the value of the test statistic provided by Excel, the p=value, and your conclusion
Step by Step Solution
There are 3 Steps involved in it

Get step-by-step solutions from verified subject matter experts


