Answered step by step
Verified Expert Solution
Link Copied!

Question

1 Approved Answer

1. Loaded-Up Fund charges a 12b-1 fee of 1% and maintains an expense ratio of .75%. Economy Fund charges a front-end load of 2% but

1. Loaded-Up Fund charges a 12b-1 fee of 1% and maintains an expense ratio of .75%. Economy Fund charges a front-end load of 2% but has no 12b-1 fee and has an expense ratio of .25%. Assume the rate of return on both funds' portfolios (before any fees) is 6% per year. How much will an investment in each fund grow to after:

a.1 year?

b.3 years?

c.10 years?

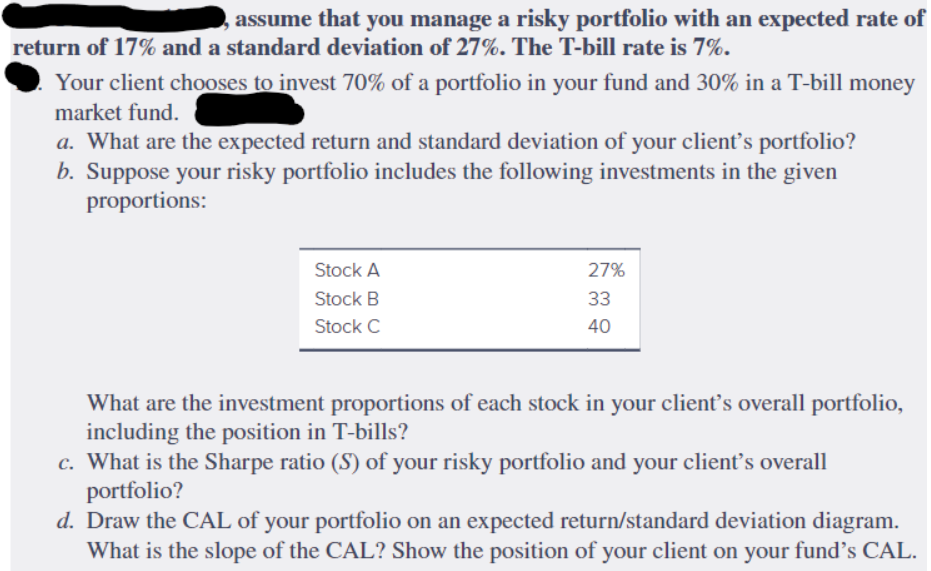
2. A. Suppose you forecast that the standard deviation of the market return will be 20% in the coming year. If the measure of risk aversion is A= 4, what would be a reasonable guess for the expected market risk premium?

B. What value of A is consistent with a risk premium of 9%?

C. What will happen to the risk premium if investors become more risk tolerant?

3.

image text in transcribedimage text in transcribedimage text in transcribed
~ assume that you manage a risky portfolio with an expected rate of return of 17% and a standard deviation of 27%. The T-hill rate is 7%. .. Your client chooses to invest 70% of a portfolio in your fund and 30% in a Tbill money market fund. a. What are the expected return and standard deviation of your client's portfolio? 1?. Suppose your risky portfolio includes the following investments in the given proportions: Stock A 27% Stock B 33 Stock C 40 What are the investment proportions of each stock in your client's overall portfolio. including the position in Tbills? c. What is the Sharpe ratio (S) of your risky portfolio and your client's overall portfolio? (1. Draw the CAL of your portfolio on an expected returnfstandard deviation diagram. What is the slope of the CAL? Show the position of your client on your fund's CAL. _-- - F Stock Fund Bond Fund Probability Rate of Return Col B X Col C Rate of Return Col B X Col E 3 . 0.45 Mild recession Normal grow': _ Spreadsheet 1.2 A B C D E F G H I J Stock Fund Bond Fund 2 Deviation Deviation 3 Rate from Column B Rate from Column B 4 of Expected Squared X of Expected Squared X 5 Scenario Prob Return Return Deviation Column E Return Return Deviation Column I 6 Severe recession 0.05 -37 -47 2209 1 10.45 -9 -14 196 9.80 7 Mild recession 0.25 -11 -21 441 110.25 15 10 100 25.00 8 Normal growth 0.40 14 4 16 6.40 8 3 9 3.60 9 Boom 0.30 30 20 400 120.00 -5 -10 100 30.00 10 Variance = SUM(F6:F9) 347.10 Variance: 68.40 11 Standard deviation = SQRT(Variance) 18.63 Std. Dev.: 8.27 Spreadsheet 1.3 A B C D E F 1 Deviation from Mean Return Covariance 2 Scenario Probability Stock Fund Bond Fund Product of Dev Col B X Col E 3 Severe recession 0.05 -47 -14 658 32.9 4 Mild recession 0.25 -21 10 -210 -52.5 5 Normal growth 0.40 4 3 12 4.8 6 Boom 0.30 20 -10 -200 -60.0 7 Covariance = SUM: -74.8 8 Correlation coefficient = Covariance/(StdDev(stocks)"StdDev(bonds)) = -0.49

Step by Step Solution

There are 3 Steps involved in it

Step: 1

blur-text-image

Get Instant Access to Expert-Tailored Solutions

See step-by-step solutions with expert insights and AI powered tools for academic success

Step: 2

blur-text-image

Step: 3

blur-text-image

Ace Your Homework with AI

Get the answers you need in no time with our AI-driven, step-by-step assistance

Get Started

Recommended Textbook for

Financial management theory and practice

Authors: Eugene F. Brigham and Michael C. Ehrhardt

12th Edition

978-0030243998, 30243998, 324422695, 978-0324422696

More Books

Students also viewed these Finance questions