

Question
1. Look at the companies listed in Table 8.2. Calcuate monthly rates of return for two successive five-year period. Calculate betas for each sub period
1. Look at the companies listed in Table 8.2. Calcuate monthly rates of return for two successive five-year period. Calculate betas for each sub period using the Excel SLOPE function. How stable was each comany's beta? Suppose that you had used these betas to estimate expected rates of return from the CAPM. Would your estimates have changed significantly from period to period?
2. Identify a sample of food companies. For example, you could try Campbell Soup (CPB), General Mills (GIS), Kellogg (K), Mondelez International (MDLZ), and Tyson Foods (TSN).
a.Estimate beta and R2 for each company, using five years of monthly returns and Excel functions SLOPE and RSQ.
b. Average the returns for each month to give the return on an equally weighted portfolio of the stocks. Then calculate the industry beta using these portfolio returns. How does the R2 of this portfolio compare with the average R2 of the individual stocks?
c. Use the CAPM to calculate an average cost of equity (r equity) for the food industry. Use current interest ratestake a look at the end of Section 9-2and a reasonable estimate of the market risk premium.
PLEASE ANSWER DETAIL BY DETAIL
PLEASE ANSWER QUICK IS LIVE OR DIE SITUATION!
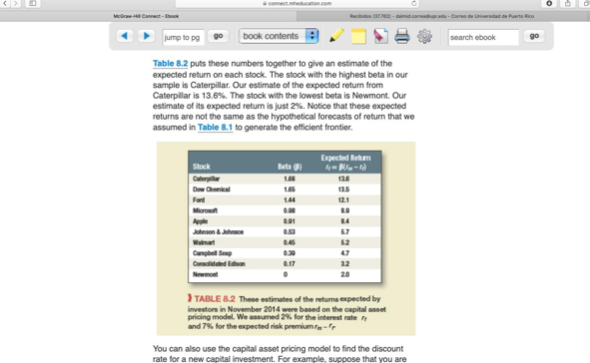
O -Camera jump to pg book contents search ebook go Table 8.2 puts these numbers together to give an estimate of the expected return on each stock. The stock with the highest betain our sample is Caterpillar. Our estimate of the expected return from Caterpillar is 13.6%. The stock with the lowest beta is Newmont. Our estimate of its expected return is just 2%. Notice that these expected returns are not the same as the hypothetical forecasts of return that we assumed in Table 8.1 to generate the efficient frontier Expected em 144 SSS Condidated on 0.17 TABLE 8.2 These estimates of the retums expected by investors in November 2014 were based on the capitale pricing model. We med 2% for the interest rate and 7% for the expected risk premium You can also use the capital asset pricing model to find the discount rate for a new capital investment. For example, suppose that you are O -Camera jump to pg book contents search ebook go Table 8.2 puts these numbers together to give an estimate of the expected return on each stock. The stock with the highest betain our sample is Caterpillar. Our estimate of the expected return from Caterpillar is 13.6%. The stock with the lowest beta is Newmont. Our estimate of its expected return is just 2%. Notice that these expected returns are not the same as the hypothetical forecasts of return that we assumed in Table 8.1 to generate the efficient frontier Expected em 144 SSS Condidated on 0.17 TABLE 8.2 These estimates of the retums expected by investors in November 2014 were based on the capitale pricing model. We med 2% for the interest rate and 7% for the expected risk premium You can also use the capital asset pricing model to find the discount rate for a new capital investment. For example, suppose that you areStep by Step Solution
There are 3 Steps involved in it
Step: 1

Get Instant Access to Expert-Tailored Solutions
See step-by-step solutions with expert insights and AI powered tools for academic success
Step: 2

Step: 3
Ace Your Homework with AI
Get the answers you need in no time with our AI-driven, step-by-step assistance
Get Started
Financial Markets And Institutions
Authors: Jeff Madura
8th Edition
0324568215, 978-0324568219